Have you ever wondered if you're running the right fork pressure? I've been riding the same downhill trail for months, always feeling like something was a bit off with my suspension. My fork felt either too harsh or I wasn't using all my travel. So I decided to put science to the test.
Using TrailMetry's suspension telemetry system with Witmotion sensors, I ran the same trail twice: once at 98 PSI and once at 130 PSI. The results were eye-opening and taught me more about suspension setup than years of guesswork ever could.
The Setup
Before diving into the data, let me set the scene. The trail I chose is a local downhill favorite – about 1 kilometers of mixed terrain with everything from smooth berms to rock gardens and root sections. It's technical enough to challenge the suspension but consistent enough to make for fair comparison.
📋 Test Conditions
Trail: Technical downhill with mixed terrain
Weather: Dry conditions, similar temperatures
Bike: Full suspension mountain bike with air fork
Sensor: Witmotion WT9011DCL mounted on lower fork leg
Goal: Compare suspension performance at two different pressures
I started with 98 PSI – a pressure I'd been running for a while that felt pretty good. After the first run, I pumped up to 130 PSI, which several riders at my local bike park recommended for more support. I wanted to see if firmer was actually better, or if I was giving up performance for a false sense of security.
The beauty of telemetry is that it removes guessing. Instead of relying on how something "feels" – which can be influenced by fatigue, adrenaline, or just wishful thinking – the sensors capture exactly what the suspension is doing, 100 times per second.
First Run: 98 PSI - The Baseline
I started the day with my usual setup: 98 PSI in the fork. This is what I'd been running for the past few weeks, and honestly, it felt pretty good. The bike felt planted, I had good traction, and I was confident through the rough sections.
But "feeling good" is subjective. What does the data say?
✨ The 98 PSI Experience
Dropping into the trail, the fork felt supple off the top. It soaked up the small chatter and roots that come early in the trail. Through the rock garden section, I could feel it working deep into the travel, using the whole stroke. On the big compressions, it absorbed everything without a harsh bottom-out. It felt... right.
After the run, I pulled up the TrailMetry app to see what actually happened. The numbers told a compelling story that matched my experience perfectly.
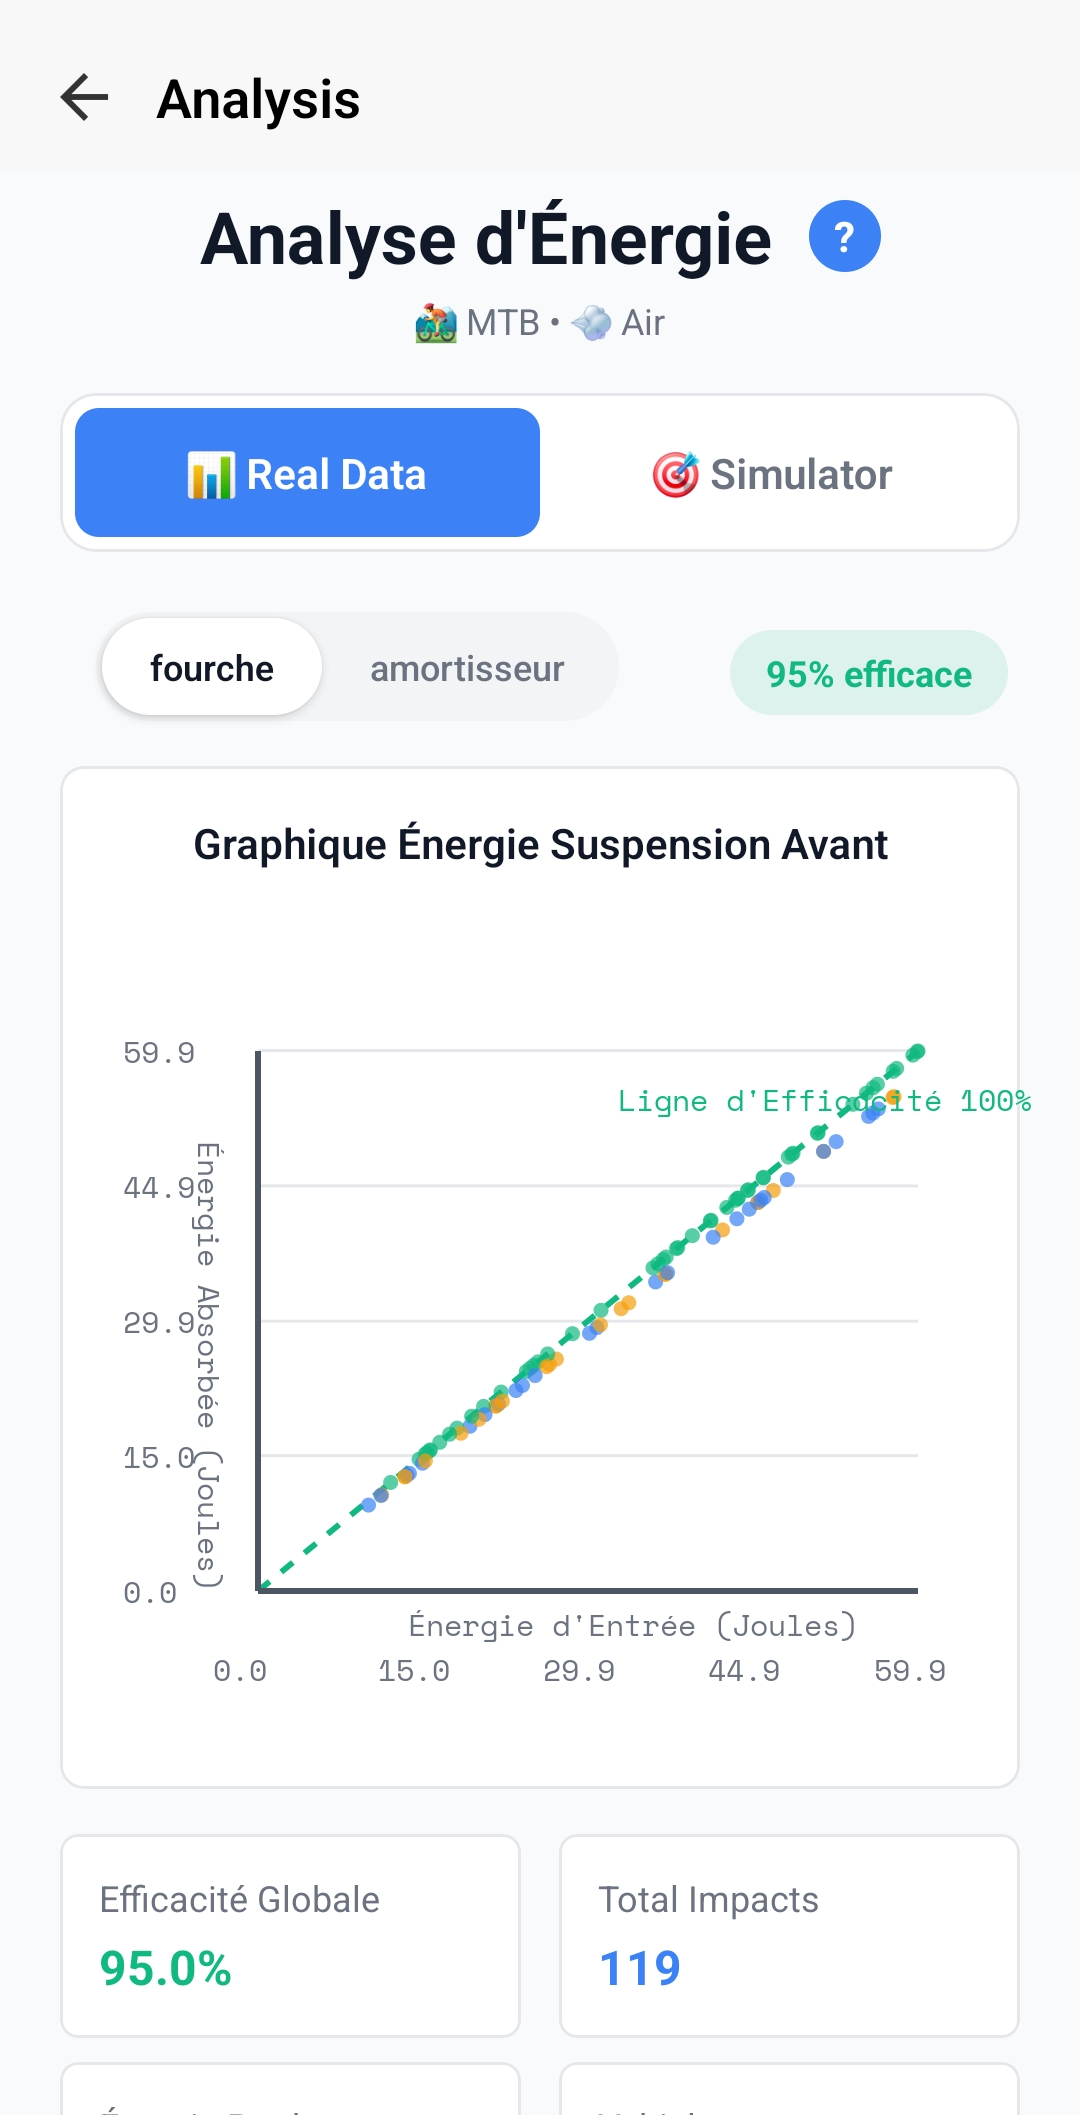
98 PSI - The Data Reveals Optimal Performance
 Optimal
Energy Efficiency: 95%
The energy absorption graph shows nearly perfect efficiency. The data points cluster tightly along the 100% efficiency line, meaning the fork is absorbing and managing impacts optimally with minimal energy loss.
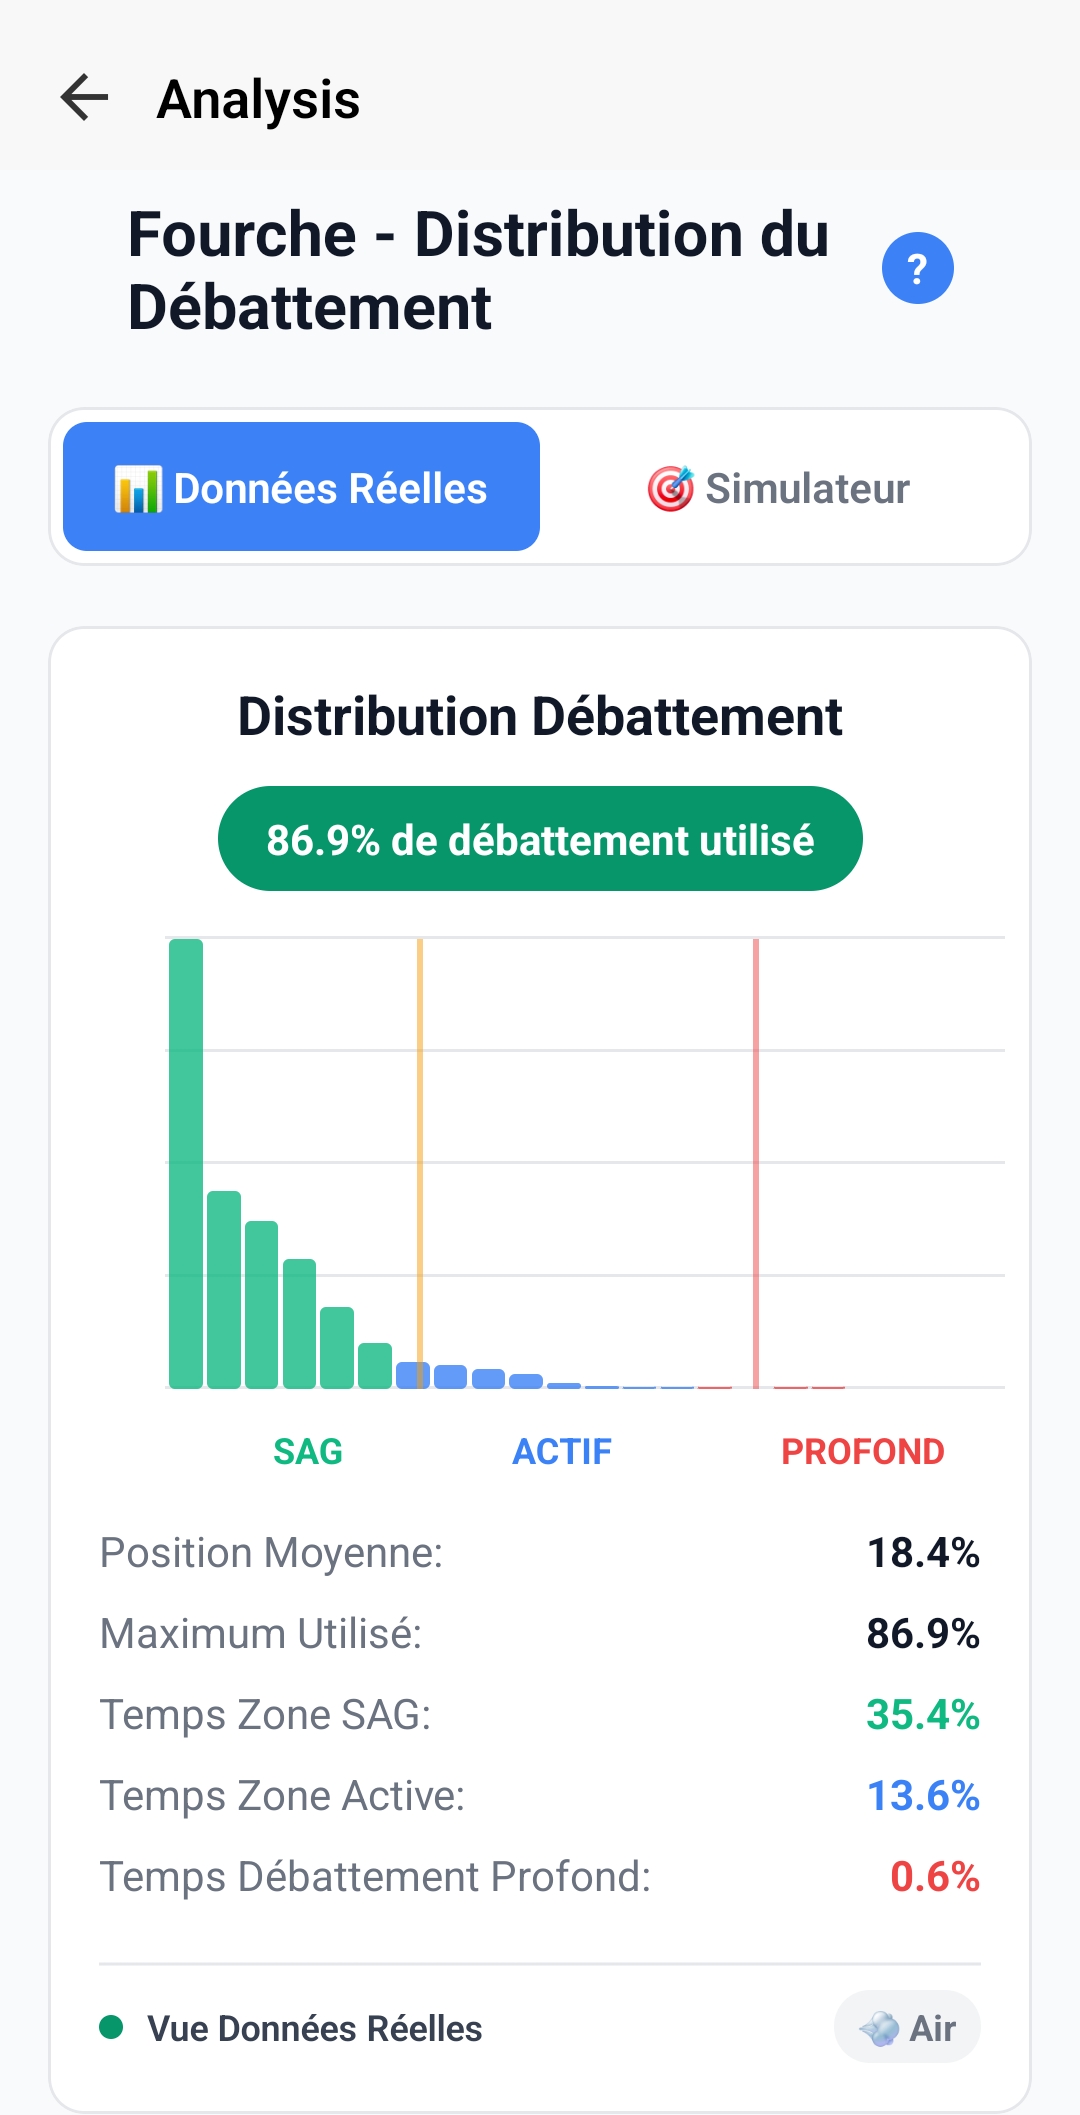 86.9% Used
Travel Distribution
Excellent travel usage pattern. The histogram shows good distribution across SAG and active zones with appropriate deep travel engagement – exactly what you want for aggressive riding.
What the 98 PSI Numbers Mean
Breaking down the performance metrics from the first run
Outstanding efficiency means the fork is absorbing impacts smoothly with minimal energy wasted. This translates to better traction and control.
Using 87% of available travel is ideal – accessing the full stroke without constant harsh bottom-outs. The 0.6% in deep travel shows proper bottom-out resistance.
Perfect distribution. The fork spends adequate time in SAG for small bumps and plenty of time actively working through mid-size impacts.
Lower impact count suggests the fork is absorbing bumps progressively rather than treating each one as a discrete spike.
Looking at these numbers, I could see why the fork felt so good. The 95% energy efficiency meant it was absorbing impacts smoothly. The 86.9% travel usage showed I was accessing the full stroke without bottoming out constantly (only 0.6% of the time in deep travel). And that 13.6% active zone time? That meant the suspension was actually working through the middle of its travel where it's most effective.
Second Run: 130 PSI - The "More Support" Approach
After reviewing the first run data, I was curious. Several experienced riders had suggested I run more pressure for better support and to prevent bottoming out. So I pumped the fork up to 130 PSI and headed back to the top of the trail.
🤔 The 130 PSI Experience
Right from the start, things felt different. The fork felt firmer, more resistant. Through the first technical section with roots and small rocks, I could feel more vibration through the bars. The bike felt like it was skipping over bumps rather than absorbing them. In the rock garden, where I'd felt so planted before, the fork felt harsh – like it was fighting the terrain instead of working with it.
My initial impression was that it felt "more supportive," but at the cost of small-bump sensitivity. I wasn't as confident pushing through the rough sections. But again – that's just how it felt. What did the data actually show?
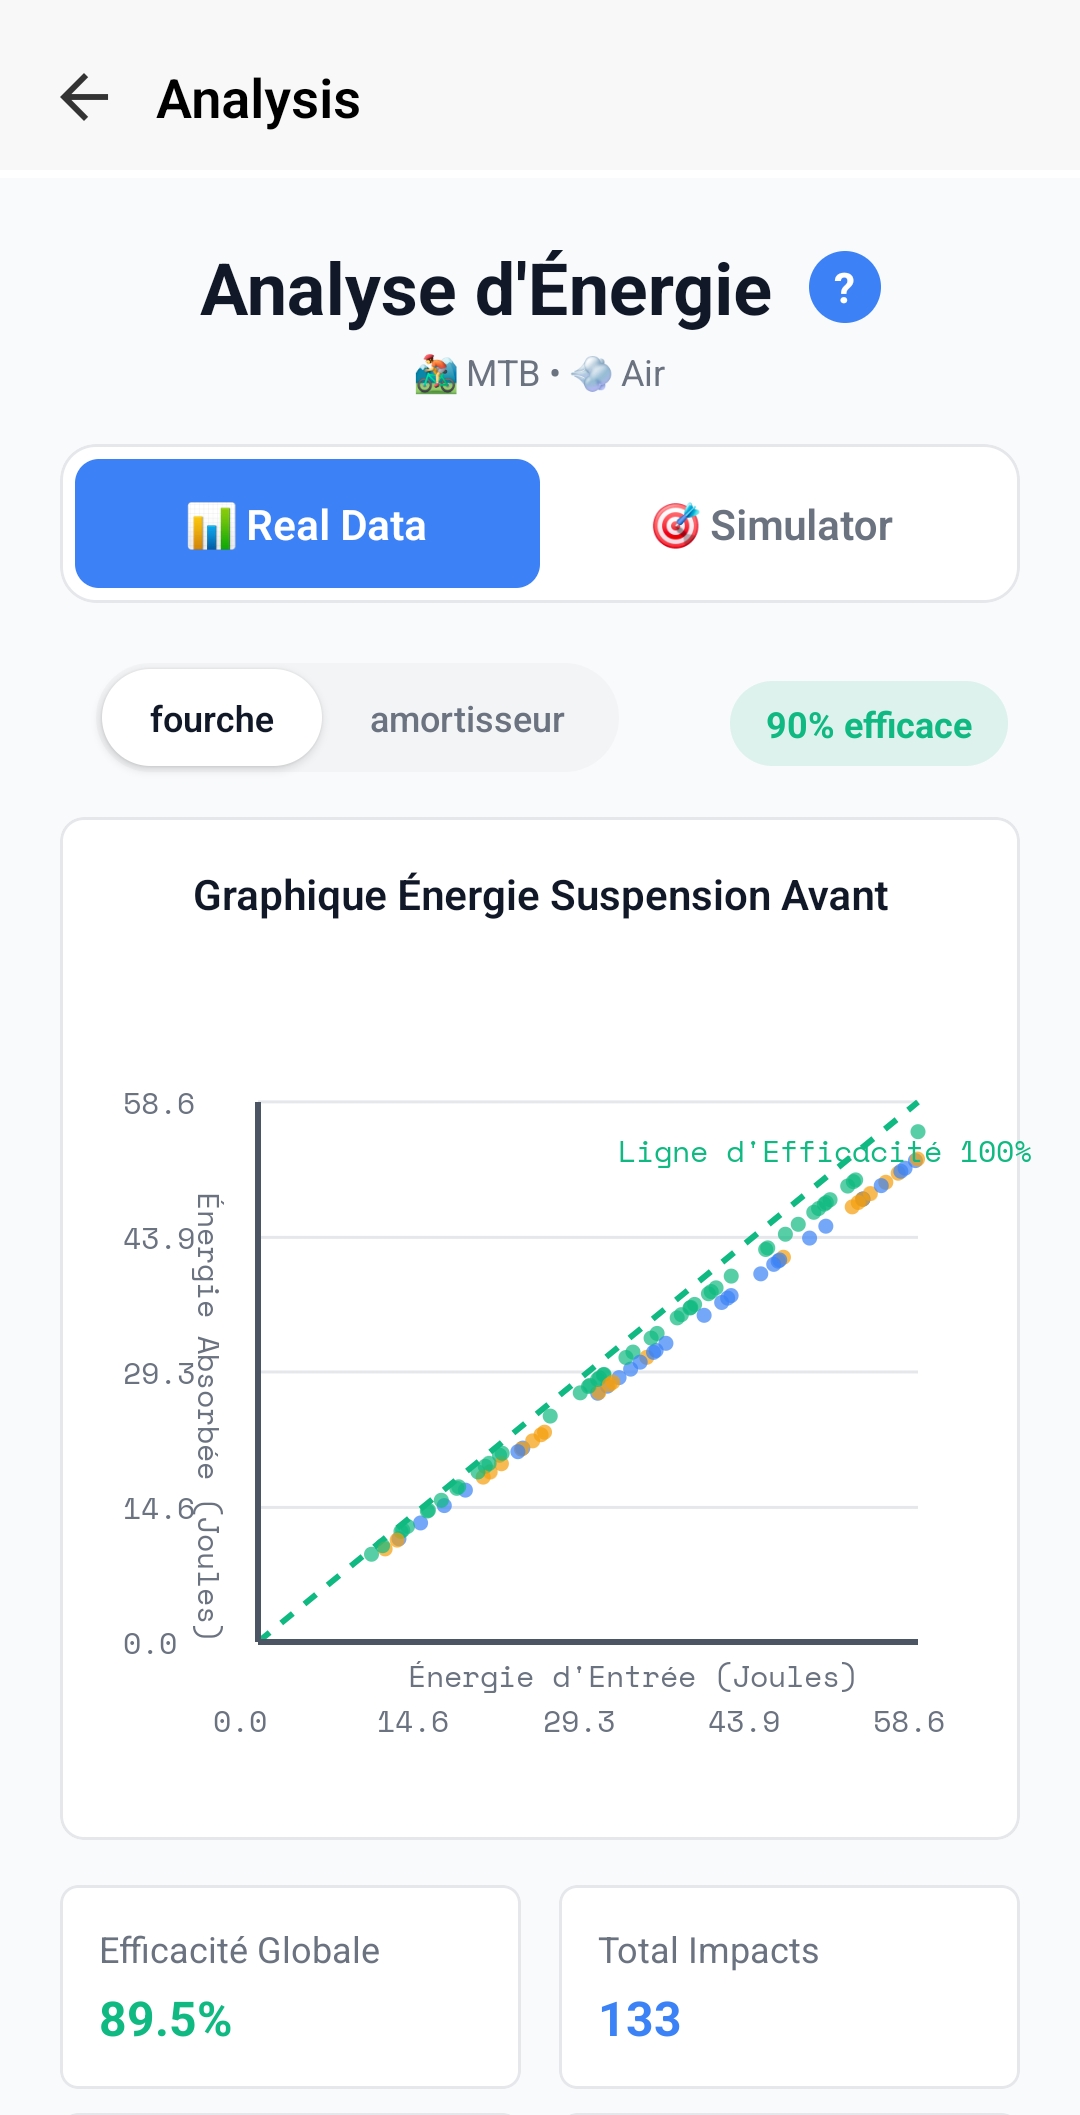
130 PSI - When Firmer Isn't Better
 Too Stiff
Energy Efficiency: 89.5%
Notice more scatter in the data points and several orange/red points showing energy loss. The fork is transmitting more force to the rider rather than absorbing it smoothly.
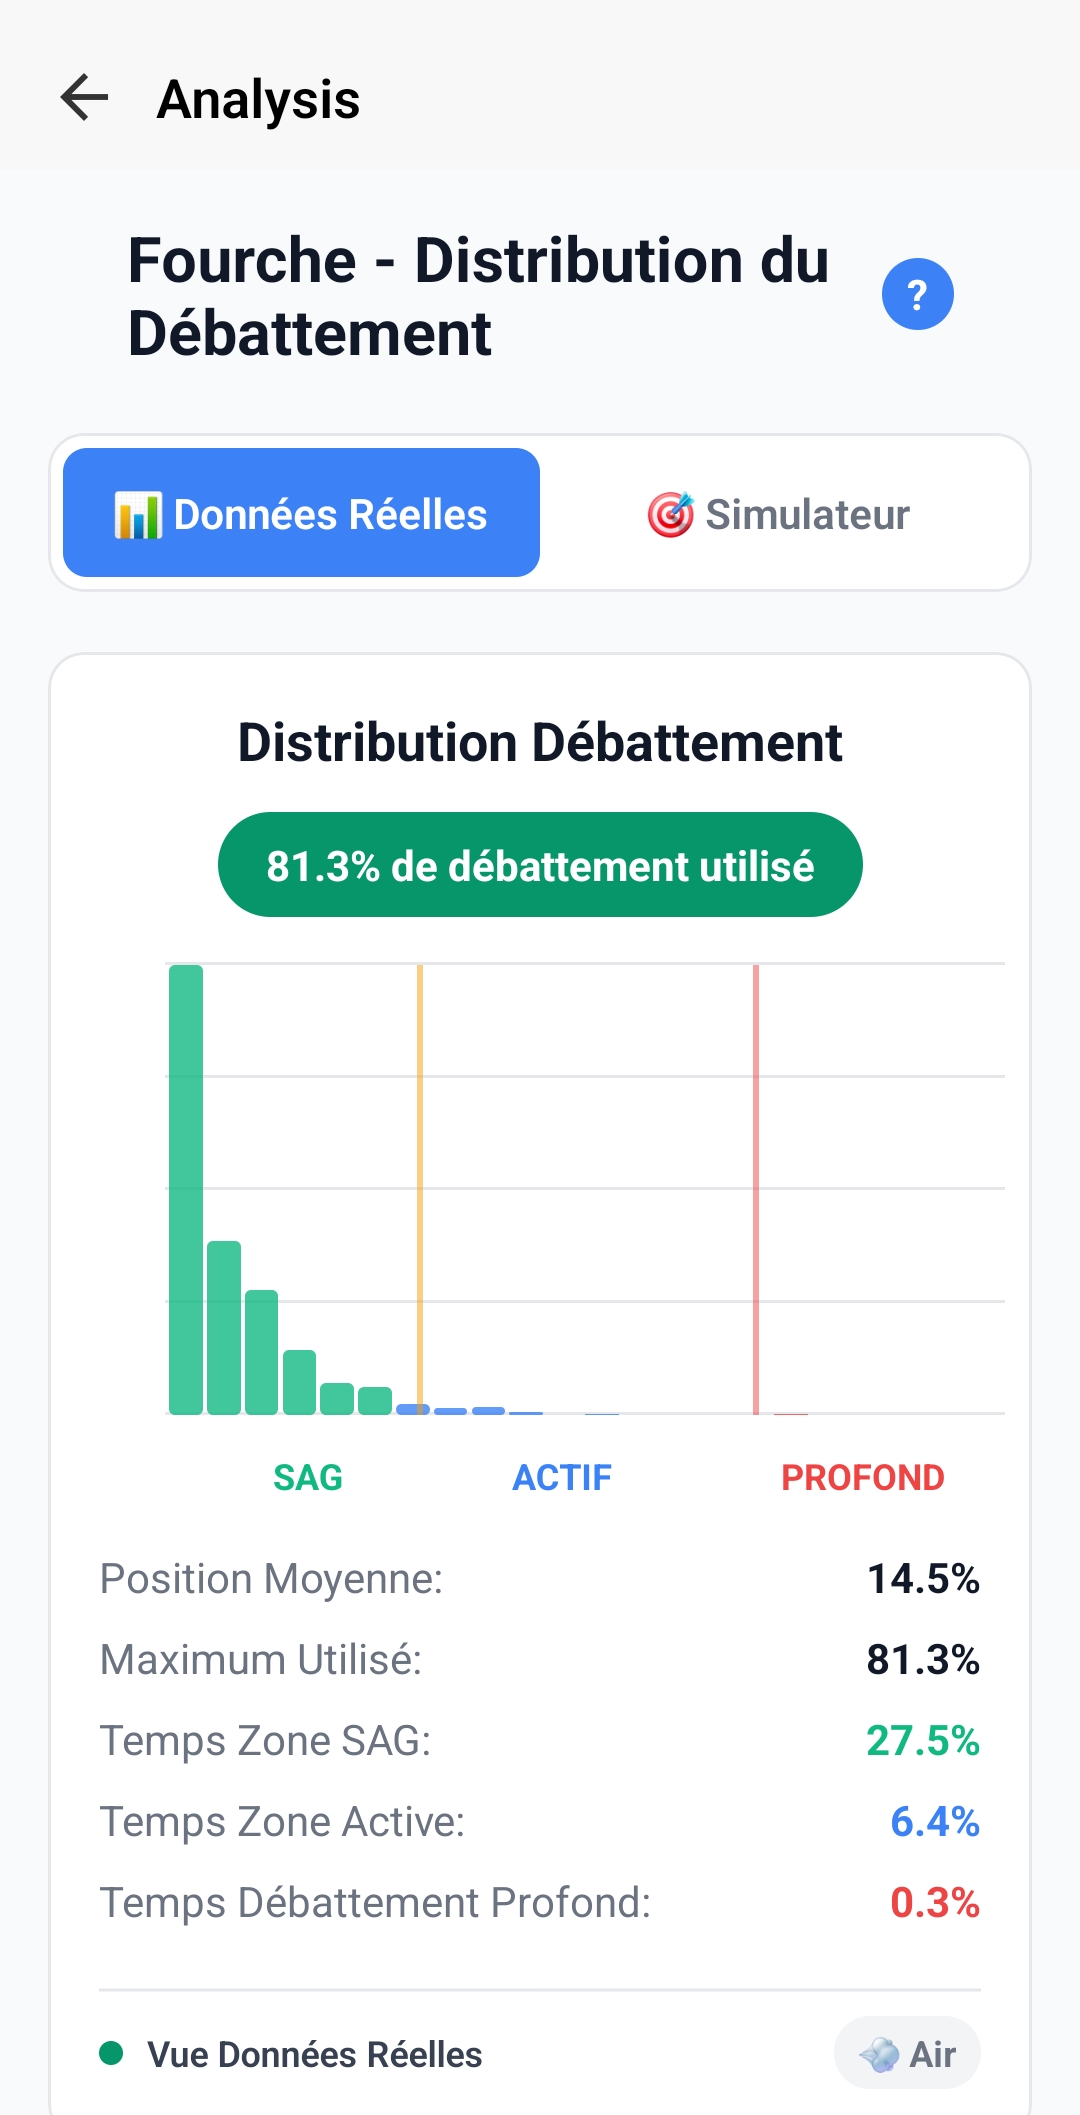 81.3% Used
Travel Distribution
The histogram shows a less ideal distribution – more concentrated in the SAG zone with significantly less time in the active working range where the suspension performs best.
The 130 PSI Reality Check
How the firmer setup actually performed
A 5.5% drop in efficiency means more energy is being transmitted through to the rider. This shows up as vibration, fatigue, and reduced control.
Not accessing the full stroke means missing out on the progressive spring rate designed to absorb big hits. You're leaving performance on the table.
Active zone time cut in half! The suspension spends much less time in its sweet spot where it works best. This explains the harsh feel.
More impacts detected suggests the fork is not smoothly absorbing bumps – instead treating each as a discrete spike.
The data confirmed my suspicions. At 130 PSI, every metric got worse. The fork was too stiff for the terrain, riding high in its travel (average position of only 14.5%), and spending half as much time in the active working zone where suspension performs best.
What really stood out was the impact count: 133 impacts versus 119 at lower pressure. You'd think a firmer fork would register fewer impacts, but the opposite happened. The stiffer setup wasn't absorbing small bumps smoothly – it was transmitting them as discrete spikes. Every root, every small rock was an "impact" rather than being progressively absorbed.
🔍 Key Findings from the Comparison
Energy Efficiency Gap
The 5.5% difference in energy efficiency is massive. At 98 PSI, the fork absorbs 95% of impact energy. At 130 PSI, that drops to 89.5%, meaning more vibration and fatigue transmitted to the rider.
Travel Utilization
Using 86.9% vs 81.3% of travel might seem small, but it means accessing the progressive part of the spring curve. The lower pressure lets the fork work through its entire stroke as designed.
Active Zone Performance
This was the most dramatic difference: 13.6% vs 6.4% time in active zone. The 130 PSI setup spends half as much time in the suspension's sweet spot where it absorbs mid-sized impacts most effectively.
Impact Response Pattern
Counter-intuitively, the stiffer fork recorded MORE impacts (133 vs 119). The firmer setup treats small bumps as discrete spikes rather than smoothly absorbing them, resulting in a harsher ride.
What This All Means
After comparing both runs, the conclusion is crystal clear: for this trail and my riding style, 98 PSI is objectively superior to 130 PSI in every measurable way.
Why Lower Pressure Won
The 98 PSI setup allows the fork to be supple at the beginning of the stroke. This is crucial for small-bump sensitivity – soaking up roots, small rocks, and trail chatter that would otherwise vibrate through to your hands. When the fork can move freely through the first part of its travel, it maintains traction and control.
But here's the key: being supple at the top doesn't mean diving through travel or bottoming out constantly. The progressive air spring ramps up as you go deeper. At 98 PSI, I was still only bottoming out 0.6% of the time – totally acceptable for aggressive riding. The fork had plenty of support when needed.
💡 The Sweet Spot Concept
Modern suspension has a "sweet spot" – the middle portion of travel where it works most effectively. Too soft, and you blow through to the harsh bottom-out zone. Too stiff, and you never get there, riding on top of the travel. The data shows 98 PSI keeps me in that sweet spot 13.6% of the time versus just 6.4% at 130 PSI.
Why Higher Pressure Failed
At 130 PSI, the fork became a pogo stick – resistant at the top of the stroke where you need suppleness most. The average suspension position tells the story: sitting at only 14.5% into travel means the fork is barely moving for small and medium inputs.
This creates a vicious cycle: the fork doesn't move for small bumps, so the tire skips and loses traction. When you hit a bigger bump, the fork has to absorb it more suddenly because it hasn't been gradually ramping up. This shows up as that harsh, chattery feeling and the increased impact count in the data.
The reduced energy efficiency (89.5% vs 95%) represents real energy being transmitted through your bike and into your body. Over the course of a long descent or full day of riding, that 5.5% adds up to significant fatigue and reduced control.
🏆 The Verdict: Data Doesn't Lie
For this trail, bike, and rider, 98 PSI delivers objectively superior performance across every metric. The fork absorbs impacts more efficiently, uses travel appropriately, spends more time in its optimal working zones, and responds more smoothly to varied terrain.
The 130 PSI setup that was recommended as "more supportive" actually provided less effective suspension performance. It felt firmer, which some riders mistake for better, but the data shows it was simply stiffer – and less functional.
This experiment proved something important: what feels "right" and what actually works best aren't always the same. Telemetry removes the guesswork and shows exactly what's happening – no feelings, just facts.
📝 What I Learned & Recommendations
Start Lower Than You Think
Many riders (including me) tend to over-inflate their suspension. The data showed that "too soft" fears were unfounded – the lower pressure still had plenty of bottom-out resistance while dramatically improving performance.
Use Data to Validate Your Setup
Without telemetry, I might have convinced myself the 130 PSI felt better because it seemed more "supportive." The data revealed the truth: it was actually working worse in every measurable way.
Pay Attention to Active Zone Time
This metric was the most revealing. Suspension that spends 10-15% of time in active zone is working properly. Much less suggests too much pressure; much more might indicate too little.
Target 85-95% Travel Usage
Using most of your travel (85%+) while keeping deep travel time under 1-2% is the sweet spot. It means you're accessing the full stroke without constant harsh bottom-outs.
Test on Consistent Terrain
Using the same trail for both tests was crucial. It eliminated variables and made the comparison valid. Pick a trail you know well and use it for all your setup testing.
Don't Trust Generic Recommendations
What works for another rider might not work for you. Weight, riding style, terrain, and bike geometry all matter. Use telemetry to find YOUR optimal setup, not someone else's.
Final Thoughts
This experiment fundamentally changed how I think about suspension setup. For years, I'd been adjusting pressure based on feel, recommendations from friends, and forum advice. Sometimes I'd hit on something good, but I never knew for sure.
Now, with data, I can see exactly what's happening. The fork at 98 PSI isn't just "feeling better" – it's measurably absorbing 5.5% more energy, using 5.6% more travel effectively, and spending twice as much time in its optimal working range. Those are real, quantifiable improvements in suspension performance.
🎯 The Power of Telemetry
Suspension telemetry takes setup from art to science. Instead of endless tweaking and wondering, you can test, measure, and optimize. You can see when you've found the sweet spot – and you can prove it with data. For anyone serious about suspension performance, it's a game-changer.
I'm sticking with 98 PSI for this trail. The data is clear, and now that I know what good suspension performance looks like in the numbers, I can confidently tune for other trails and conditions. Maybe I'll test 95 PSI next to see if I can squeeze out even more performance. Or try 100 PSI to see where the trade-off point is.
The beautiful thing is: I don't have to guess anymore. I can test, measure, and know for certain what works best. That's the power of data-driven suspension tuning.