Travel Distribution
Understanding how you use your suspension travel
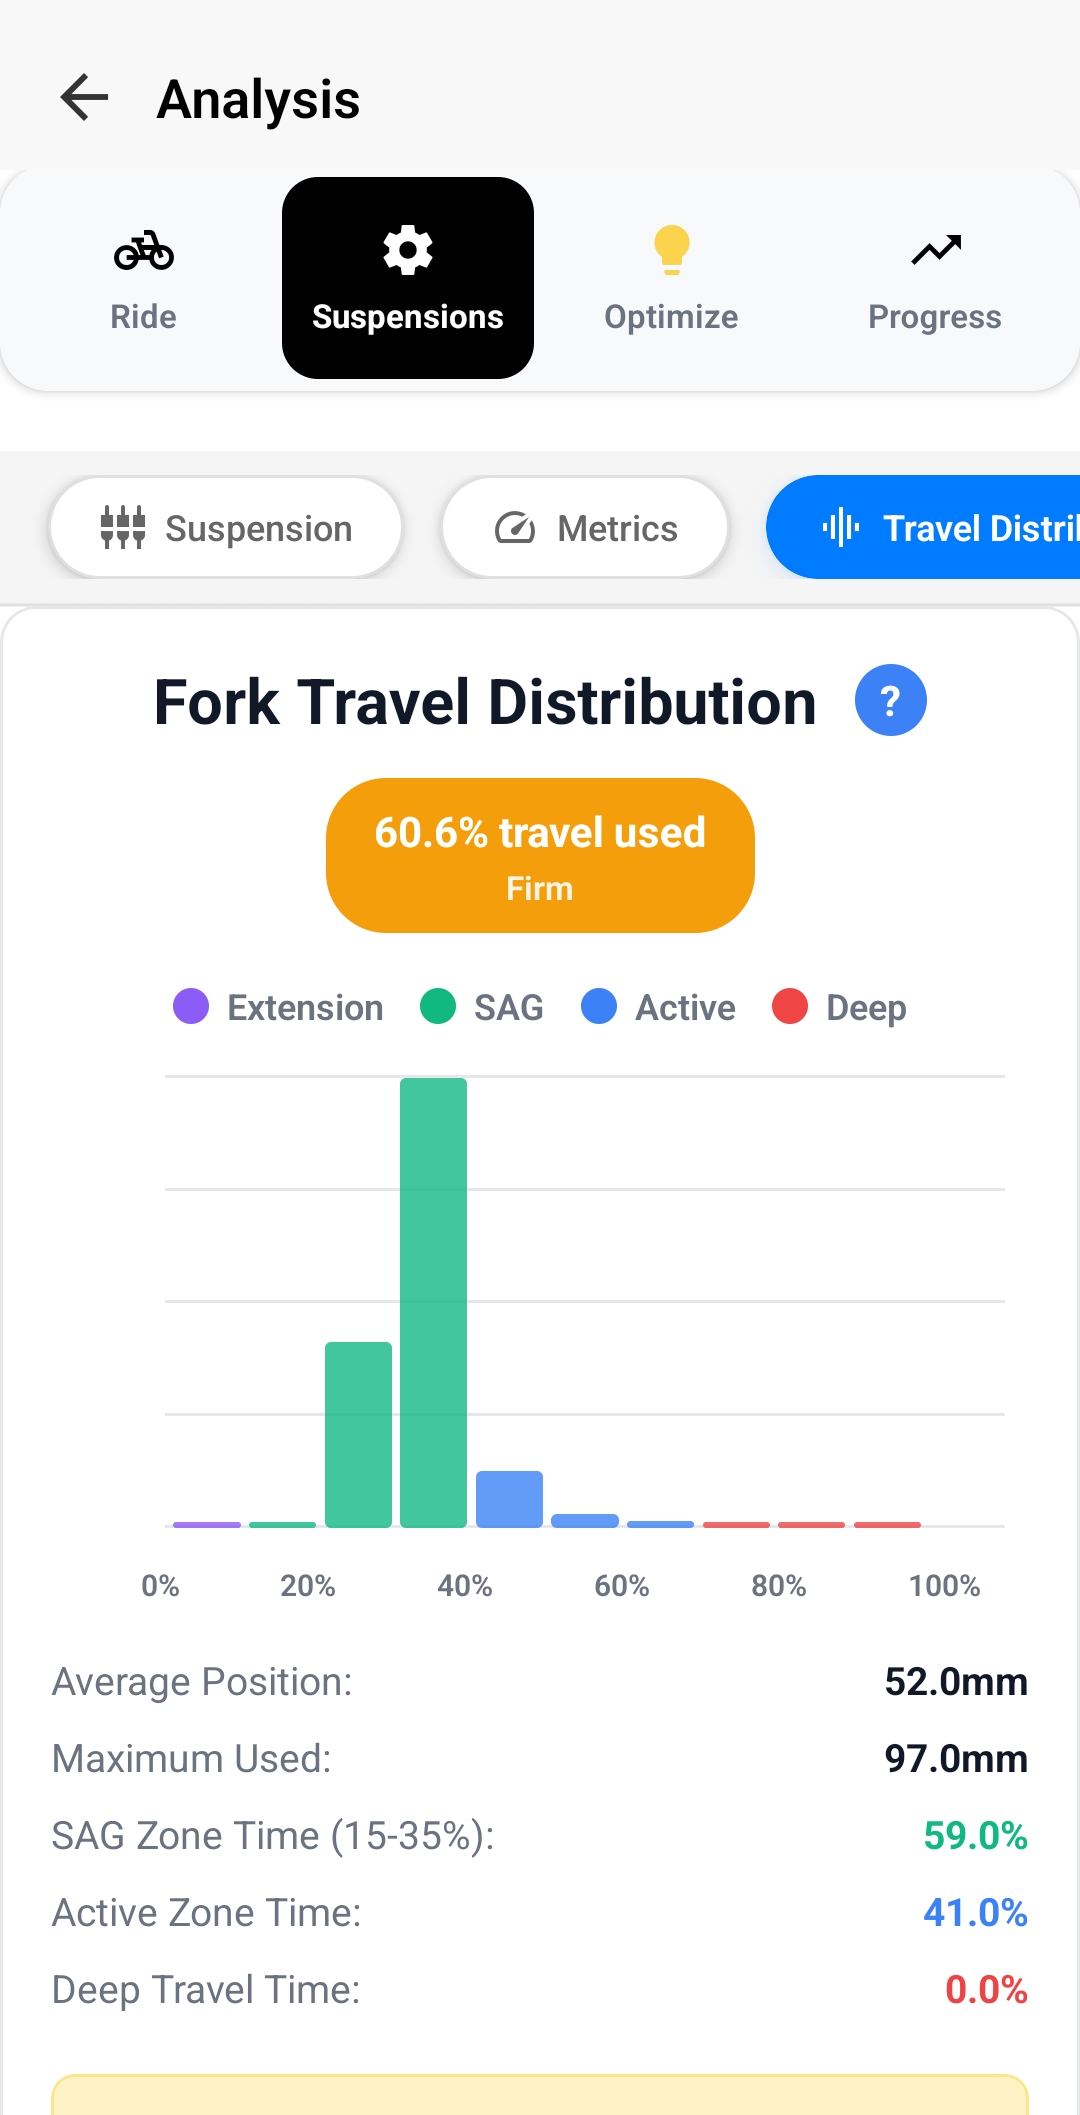
Understanding the Zones
- Extension (Purple): Suspension extending beyond sag - indicates you're riding very light or hitting compressions
- SAG Zone (Green): 15-35% of travel - your baseline riding position where suspension should spend most time on smooth terrain
- Active Zone (Blue): 35-80% of travel - working range for normal riding, absorbing bumps and impacts
- Deep Travel (Red): 80-100% of travel - reserved for big hits, drops, and harsh impacts
Key Metrics to Watch
- Average Position: Where your suspension sits most of the time - should be around 25-35% for proper sag
- Maximum Used: How deep into travel you're going - ideally 90-97% to use full travel without harsh bottom-outs
- SAG Zone Time: Percentage of ride spent in sag zone - higher values indicate smoother terrain or lighter riding
- Active Zone Time: Time spent in working range - should be highest for aggressive trail riding
- Deep Travel Time: Time in bottom range - should be minimal (1-5%) for most riding
How to Interpret Your Results
Too Firm (60% travel used, "Firm" rating):
- Not using enough travel (under 85% max)
- Spending too much time in SAG zone
- Suspension feels harsh on small bumps
- Fix: Reduce air pressure by 5-10 PSI or remove volume spacers
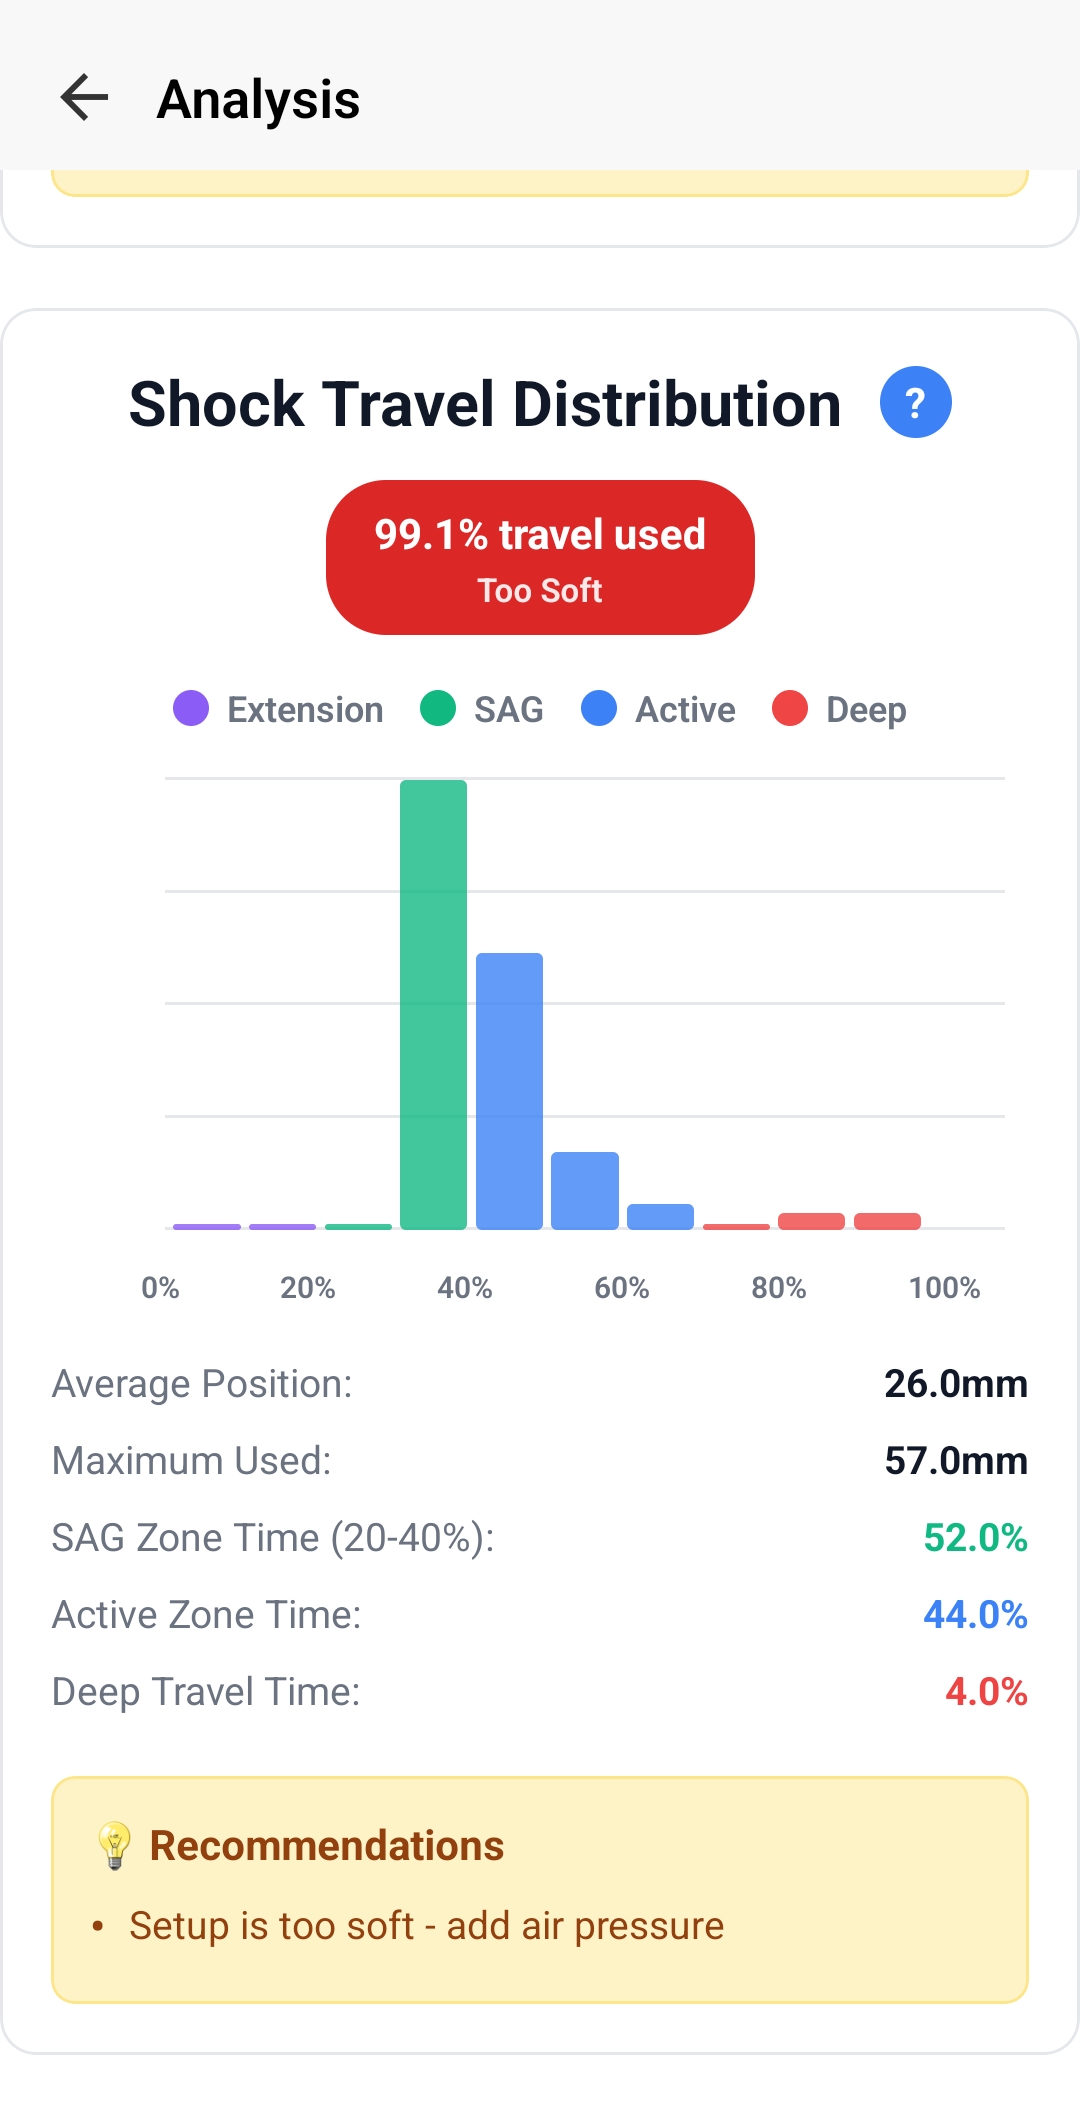
Too Soft (99% travel used, "Too Soft" rating):
- Using full travel frequently (over 95%)
- High deep travel time (over 5%)
- Feeling harsh bottom-outs
- Fix: Add air pressure by 5-10 PSI or add volume spacers for more progression
Well Balanced (85-95% travel used):
- Using 90-95% of available travel
- Good distribution across active zone
- Minimal time in deep travel (1-3%)
- Perfect - suspension is working optimally!
Energy Analysis
Measuring suspension efficiency and energy management
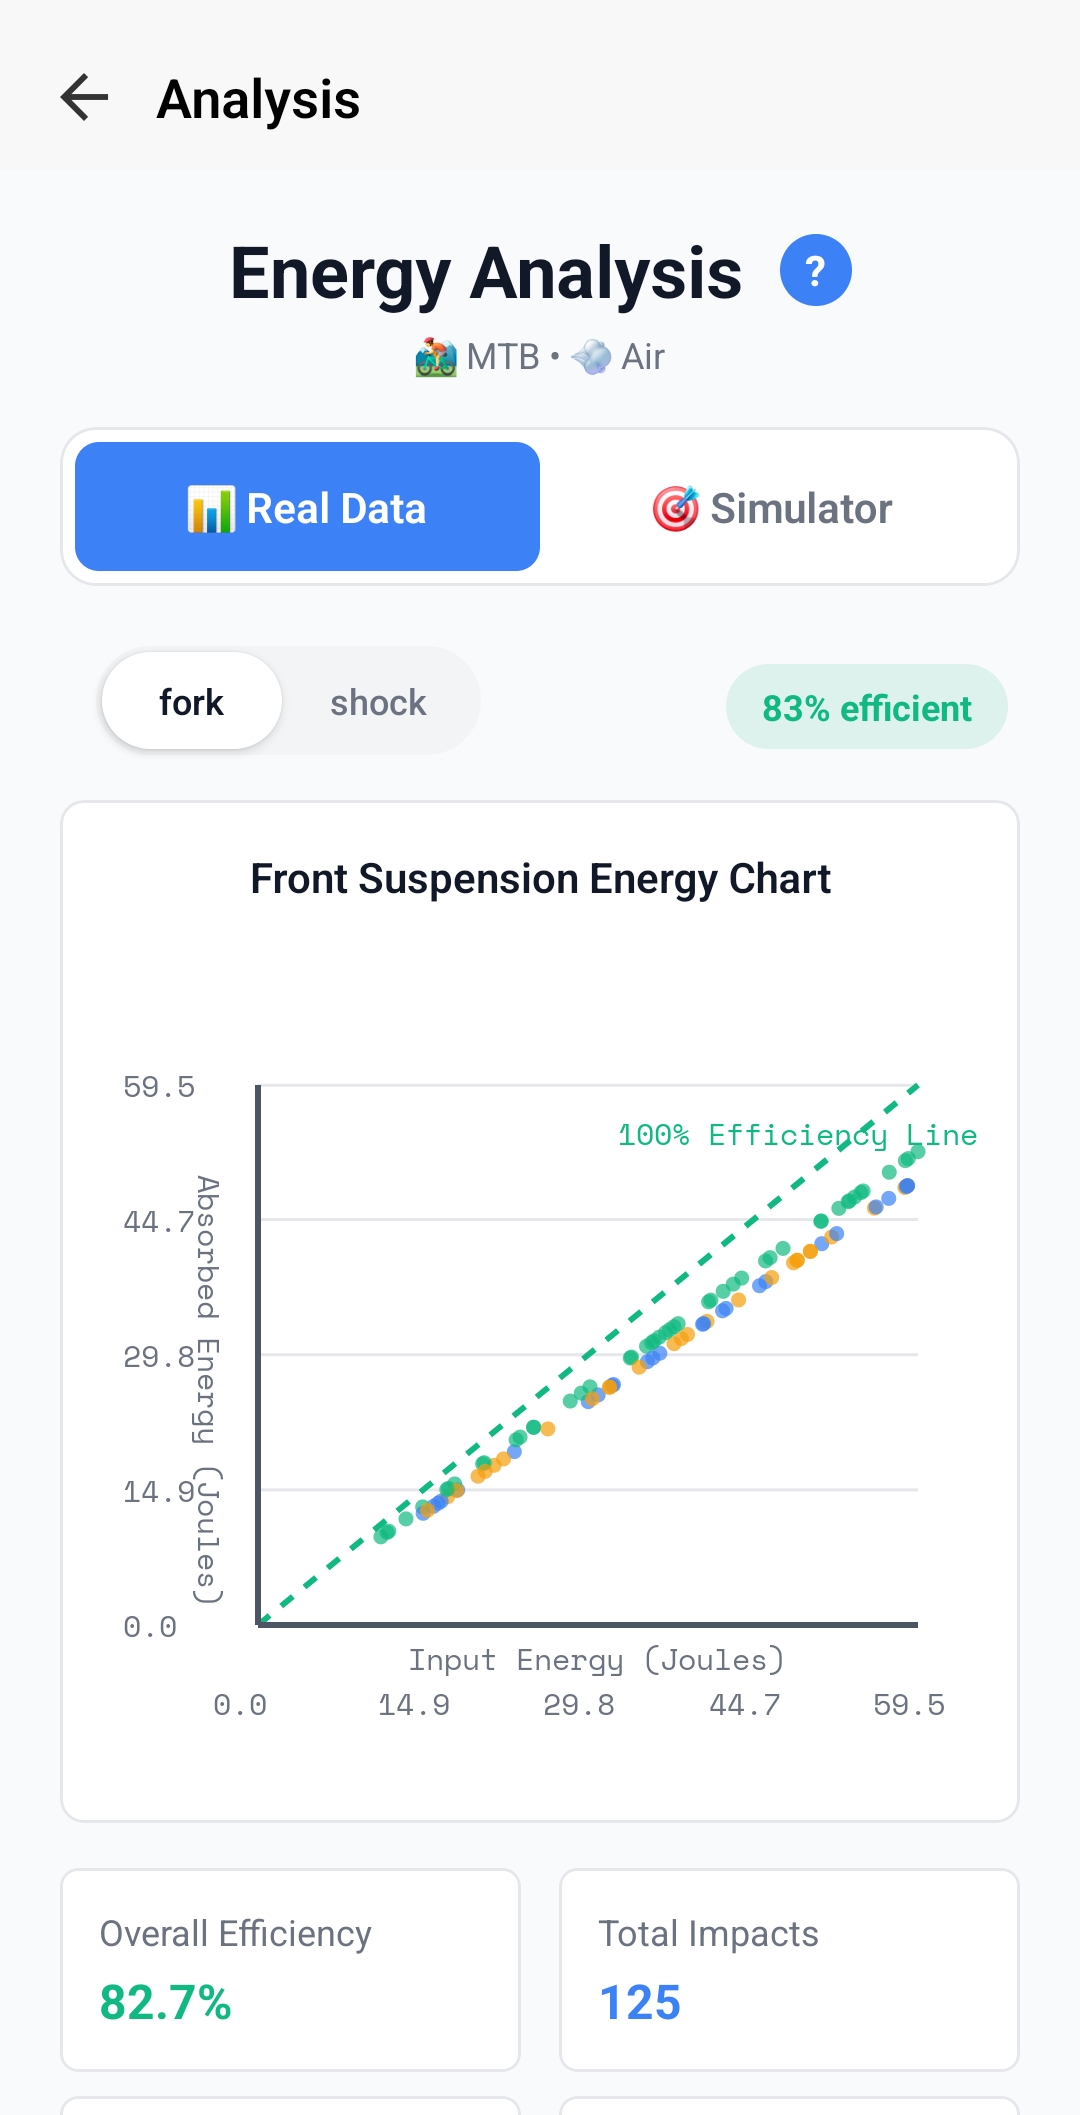
Understanding the Energy Chart
- 100% Efficiency Line (Green Dashed): Theoretical perfect efficiency - all input energy absorbed
- Data Points by Impact Severity:
- Green dots: Low-speed impacts (trail chatter, small bumps)
- Blue dots: Medium impacts (roots, rocks, moderate compressions)
- Orange dots: High impacts (drops, jumps, harsh hits)
- Point Distribution: How close points cluster to the efficiency line indicates suspension performance
Overall Efficiency Rating
- 85-100%: Excellent - suspension absorbing impacts efficiently across all speeds
- 75-85%: Good - minor tuning could improve performance
- 65-75%: Fair - suspension working but could benefit from damping adjustments
- Below 65%: Poor - significant setup issues, energy being wasted
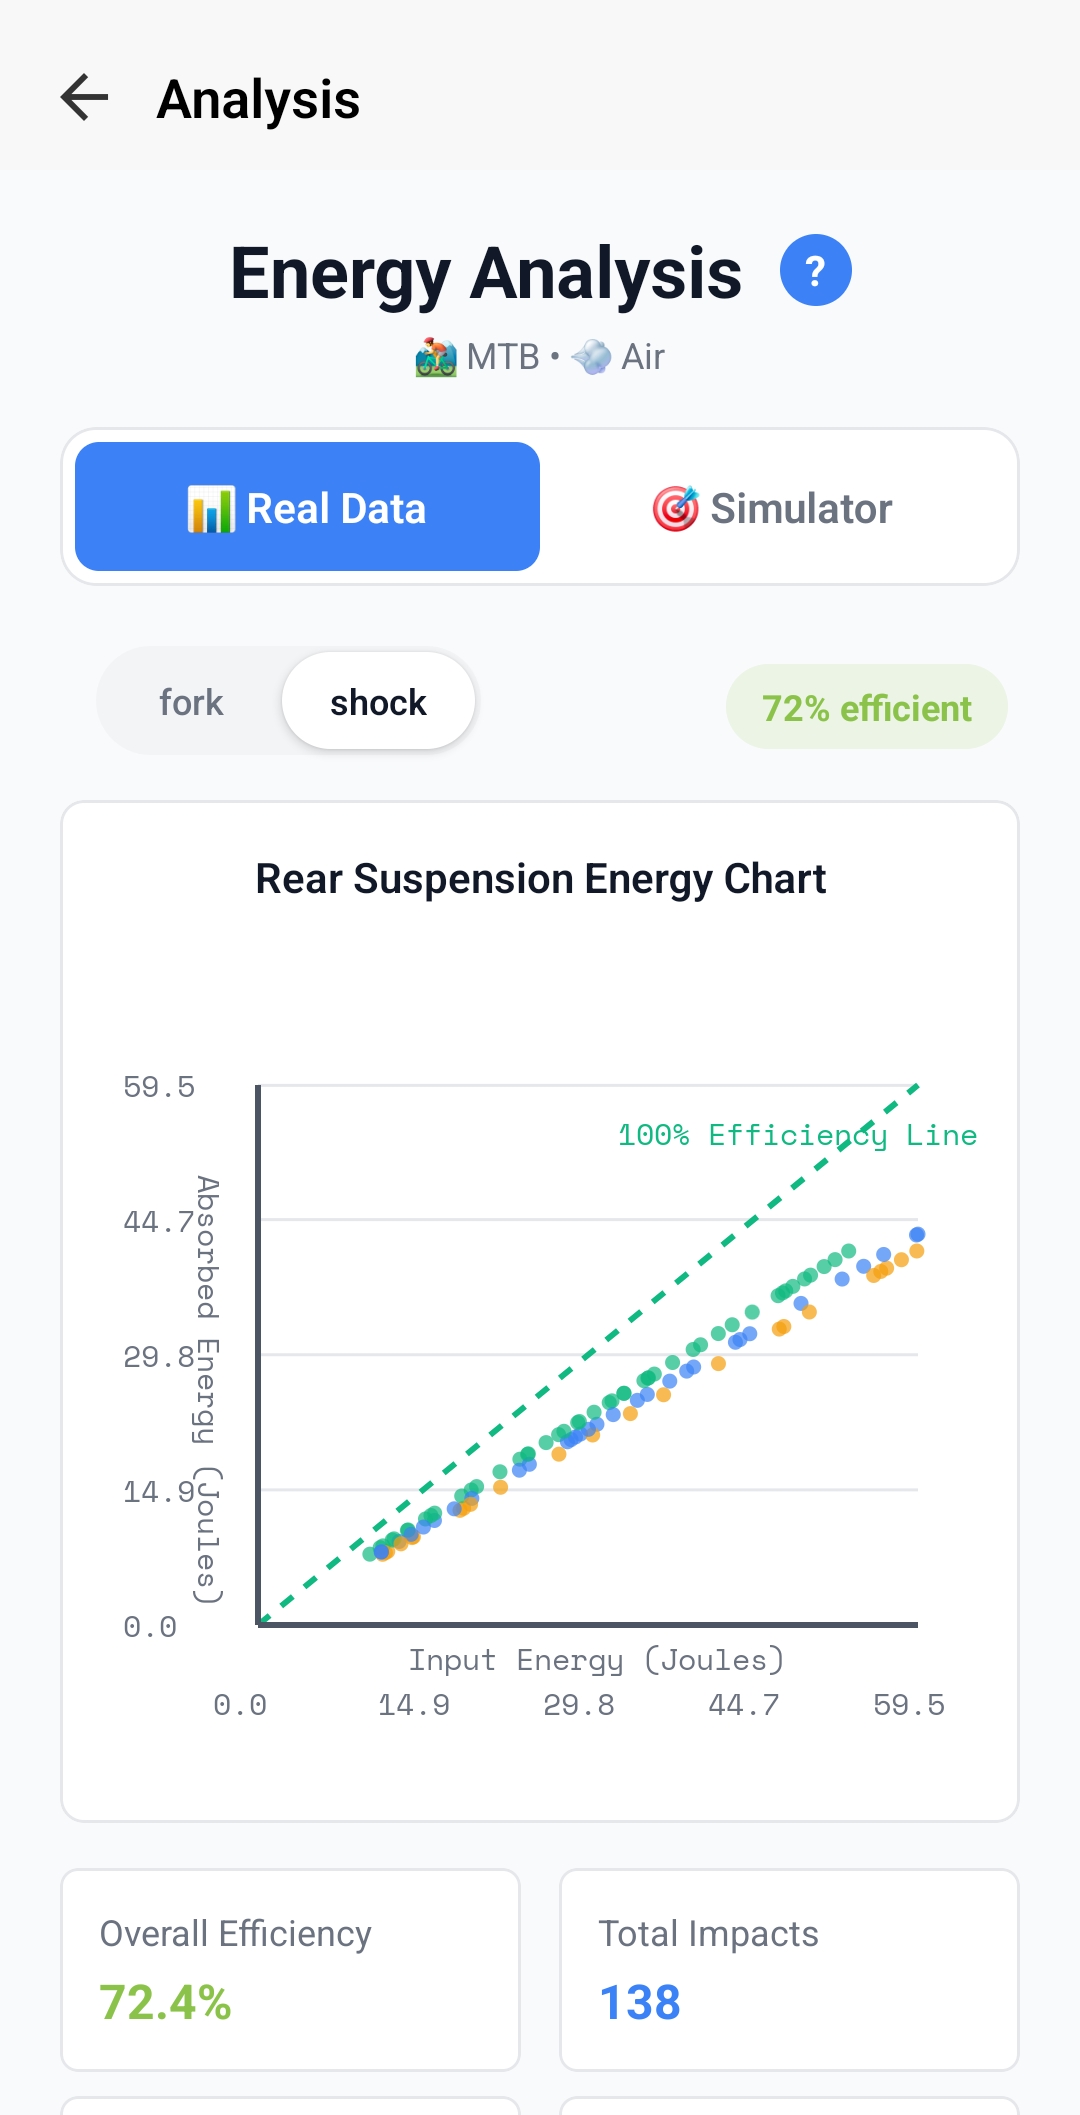
Reading Energy Patterns
Points Below Line (Low Efficiency):
- Suspension not absorbing enough energy - feeling harsh and transmitting impacts to rider
- For low-speed impacts: Add rebound damping or reduce compression damping
- For high-speed impacts: Increase compression damping (HSC) or check if bottoming out
Widely Scattered Points:
- Inconsistent performance across impact types
- May need to balance low-speed and high-speed compression
- Check air pressure and spring rate are appropriate for rider weight
Well-Clustered Near Line:
- Consistent, efficient energy absorption
- Suspension is well-tuned for your riding style
- Only make minor adjustments based on rider preference
Energy Distribution by Frequency
Understanding where your suspension is working hardest
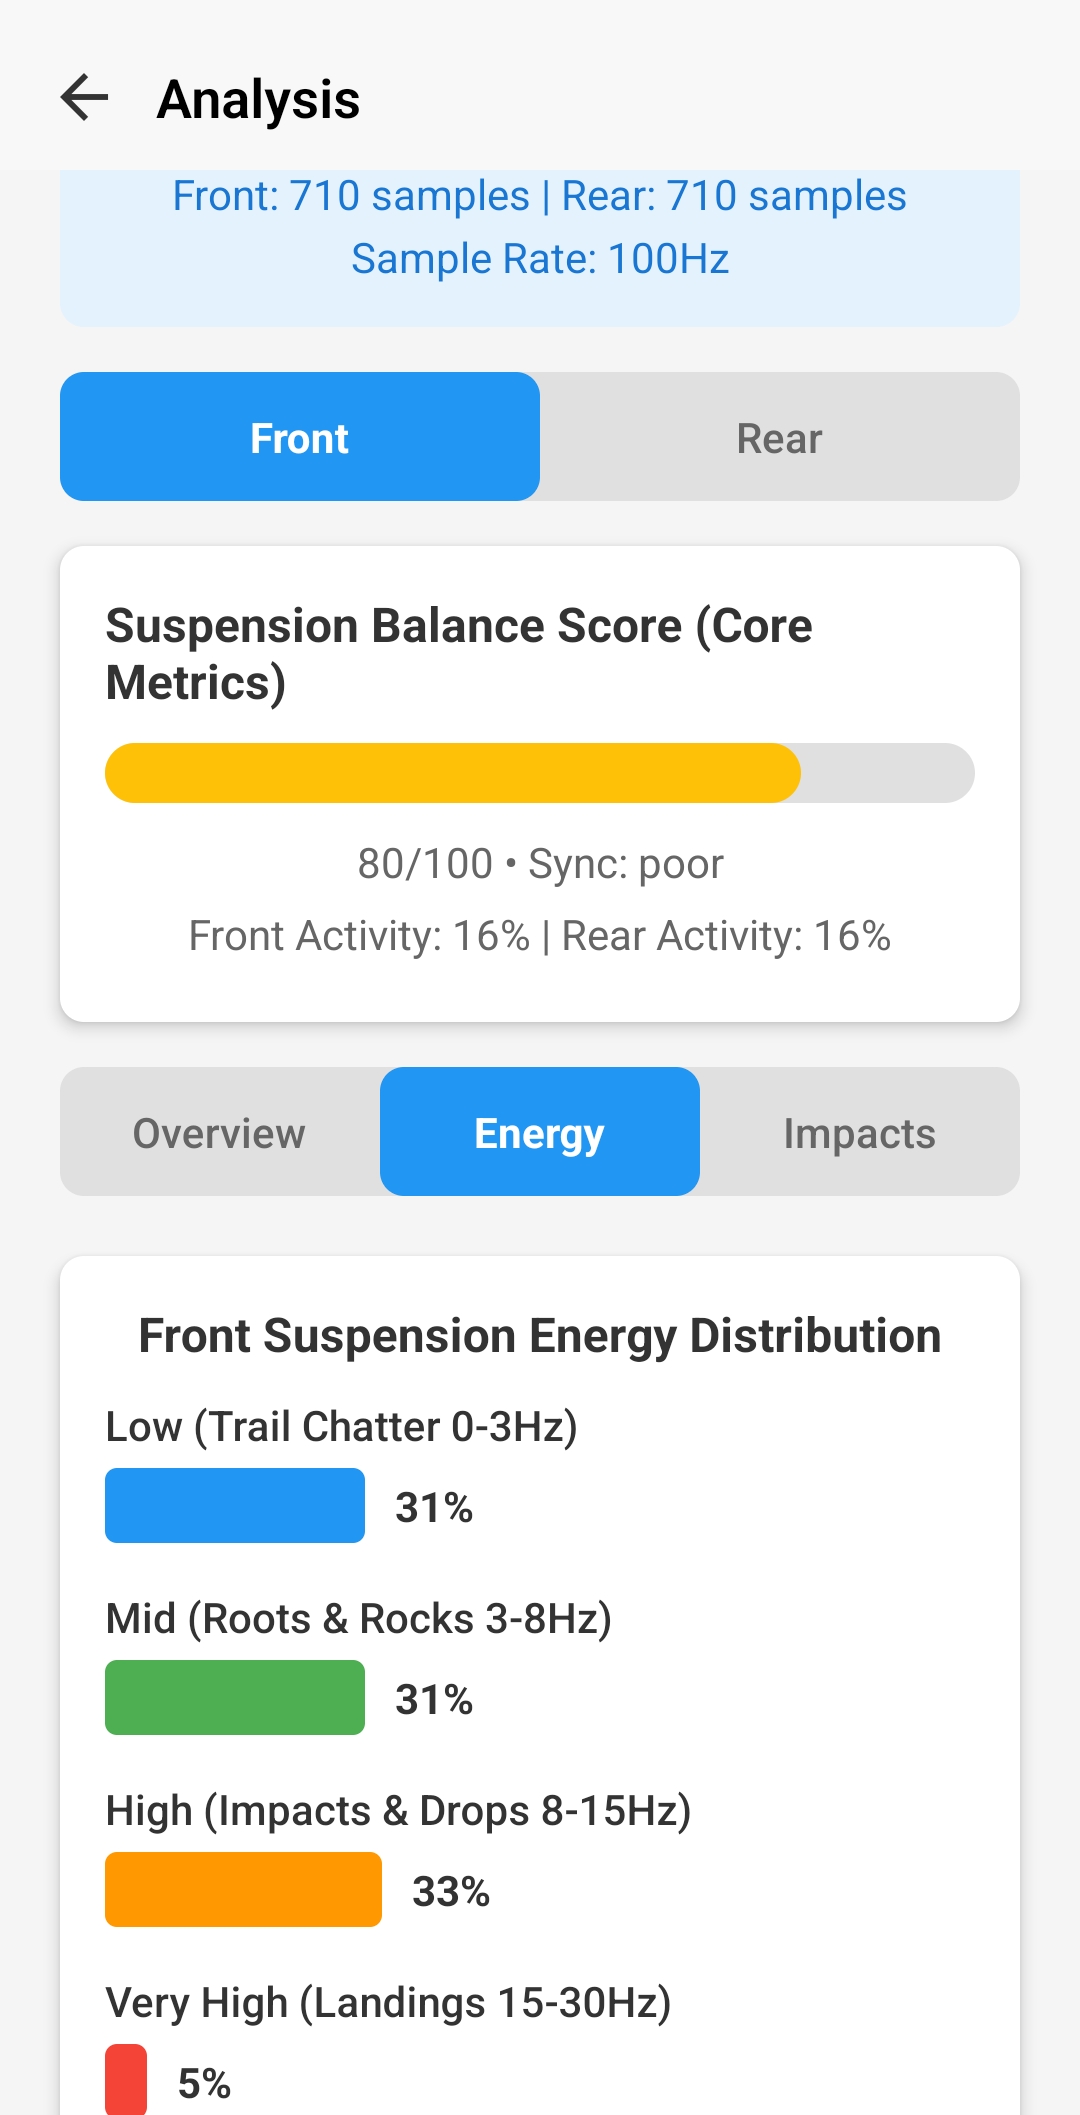
The Four Frequency Bands
- Low (0-3Hz) - Trail Chatter: Small, rapid bumps, washboard surfaces, smooth braking bumps. Controlled by low-speed compression and rebound damping.
- Mid (3-8Hz) - Roots & Rocks: Medium-sized obstacles, rock gardens, moderate roots. The "sweet spot" where suspension should be most active.
- High (8-15Hz) - Impacts & Drops: Larger hits, square-edged bumps, small drops. Requires good high-speed compression control.
- Very High (15-30Hz) - Landings: Jump landings, large drops, harsh bottom-outs. Reserved for most severe impacts.
Interpreting Your Distribution
Smooth Trail Profile (Example: 31% Low, 31% Mid, 33% High, 5% Very High):
- Balanced distribution across all bands
- Low Very High frequency (under 10%) - not hitting harsh features often
- Setup is likely well-balanced for varied terrain
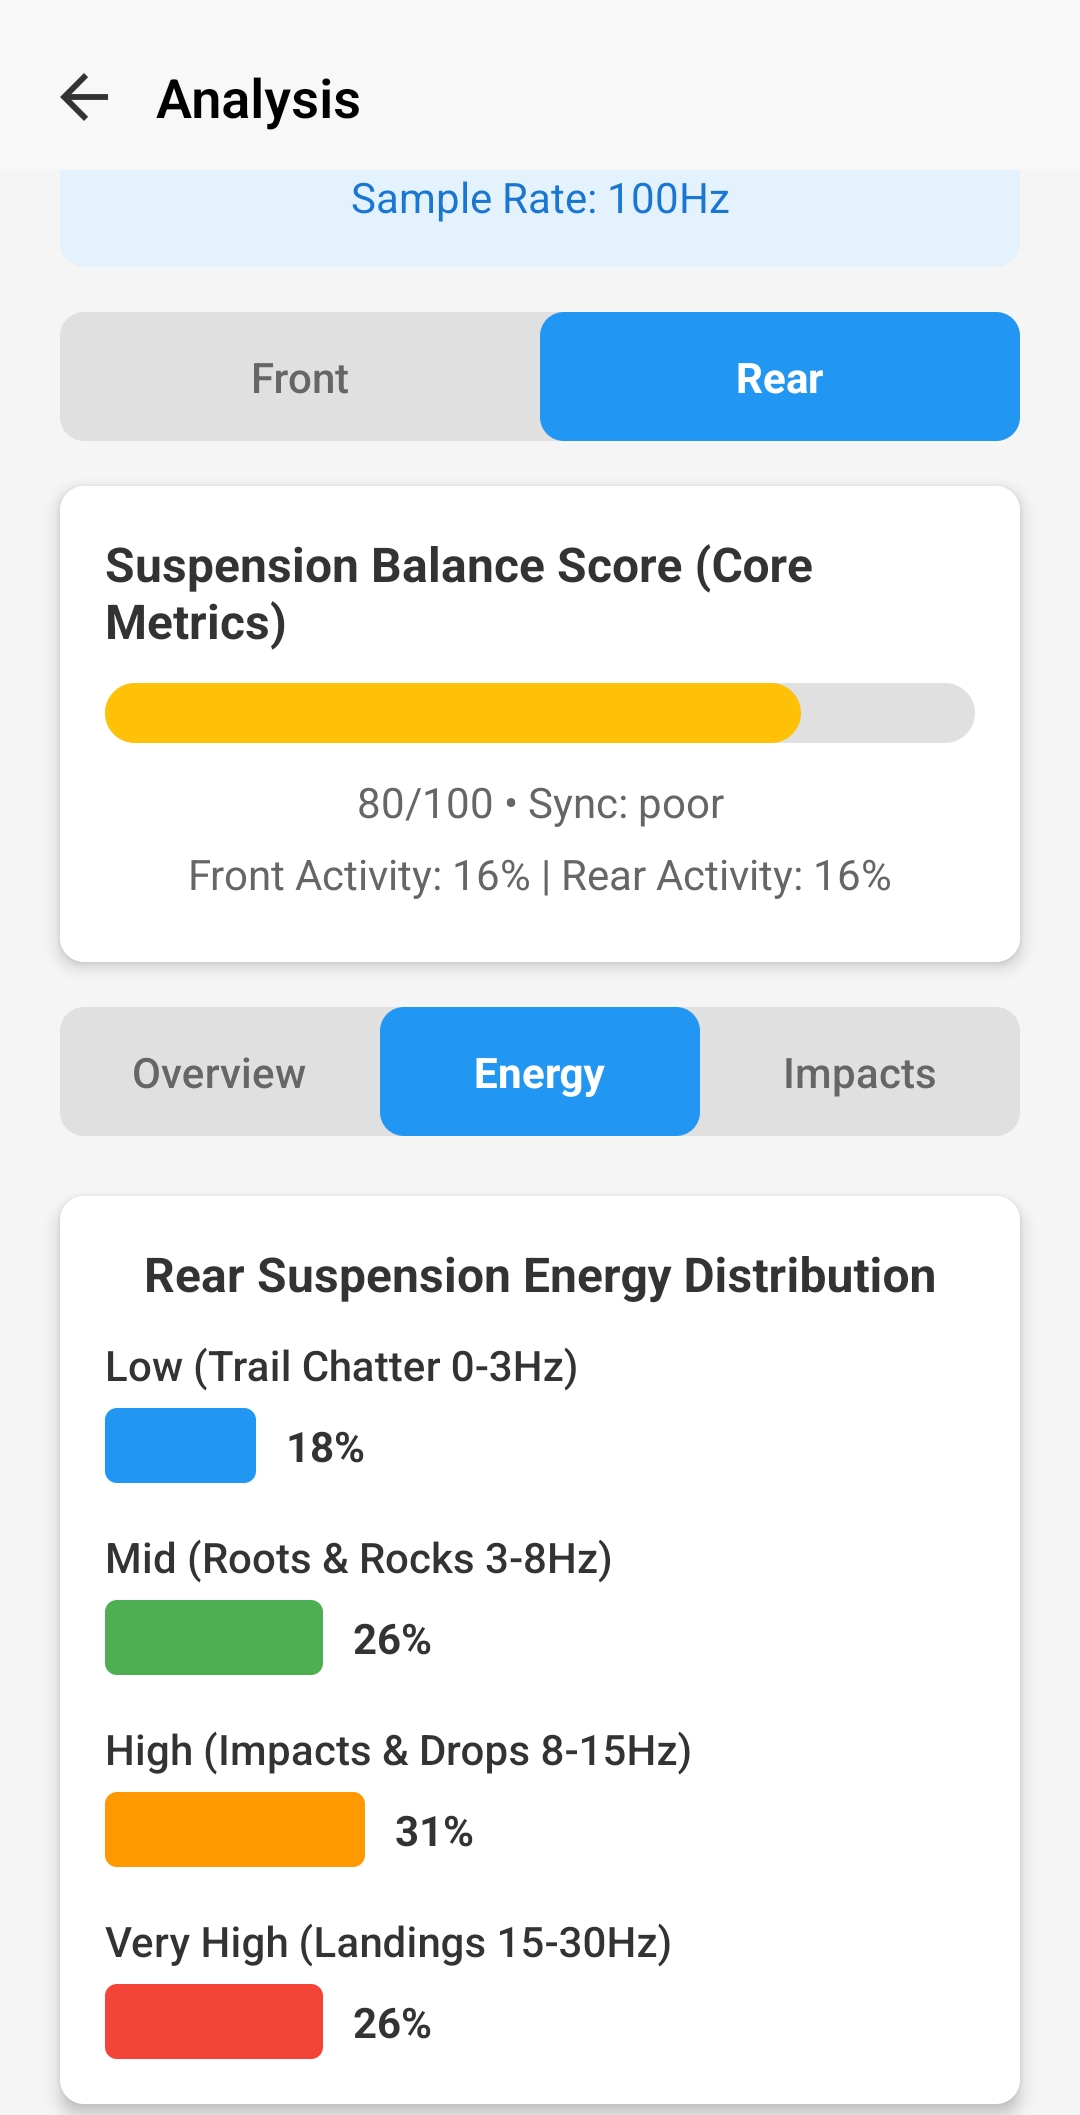
Technical Trail Profile (Example: 18% Low, 26% Mid, 31% High, 26% Very High):
- High Very High frequency (over 20%) - lots of harsh impacts, drops, or rocks
- Lower Low frequency - less time on smooth sections
- May need more high-speed compression damping or volume spacers
Using Frequency Data for Setup
- High Low Frequency %: Focus on low-speed compression and rebound settings, check sag setup
- High Mid Frequency %: This is ideal - suspension working in its designed range, maintain current setup
- High High Frequency %: May need more high-speed compression damping, consider volume spacers
- High Very High Frequency %: Check if bottoming out harshly, add air pressure or volume spacers, verify HSC is adequate
Damping Analysis
Understanding compression and rebound balance
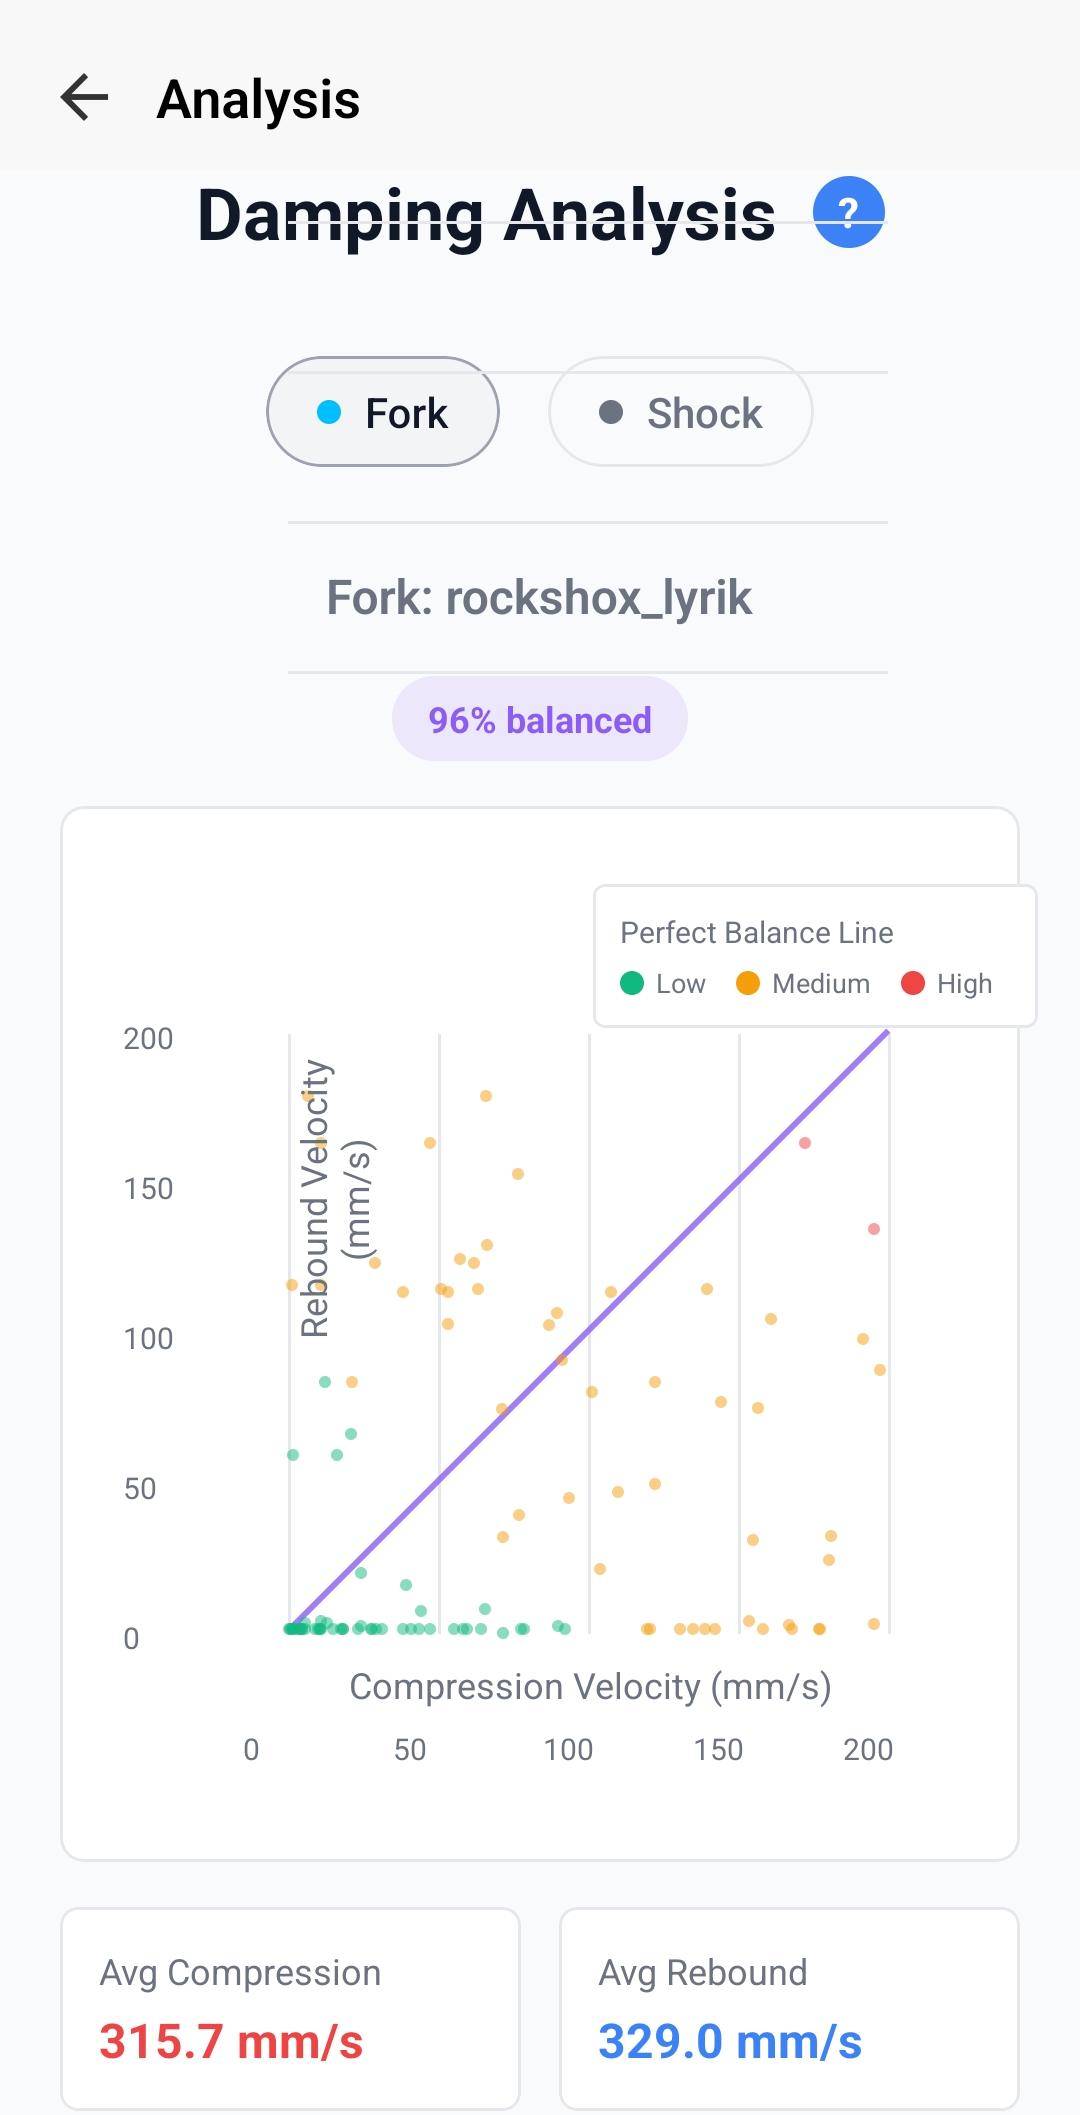
Reading the Damping Chart
- Perfect Balance Line (Diagonal): Ideal 1:1 ratio where compression and rebound speeds are matched
- Color Coding:
- Green: Low-speed events (under 50mm/s) - small bumps and trail chatter
- Orange: Medium-speed events (50-150mm/s) - normal riding impacts
- Red: High-speed events (over 150mm/s) - harsh hits and drops
- Balance Score (%): How close your average performance is to ideal balance
Interpreting Damping Patterns
Well Balanced (90-100% score):
- Points cluster tightly around the diagonal line
- Average compression ≈ Average rebound (within 10-20mm/s)
- Suspension feels controlled, returns to sag quickly without packing or bouncing
- Maintain current rebound settings
Harsh Rebound (Points mostly above line, low score):
- Rebound speed higher than compression speed
- Suspension feels harsh, kicks back on bumps, loses traction
- Add rebound damping (slower rebound) - close rebound clickers by 2-3 clicks
Slow Rebound (Points mostly below line, low score):
- Rebound speed lower than compression speed
- Suspension packs down on repeated hits, feels dead, sits lower in travel
- Reduce rebound damping (faster rebound) - open rebound clickers by 2-3 clicks
Velocity Analysis
Understanding suspension speed characteristics
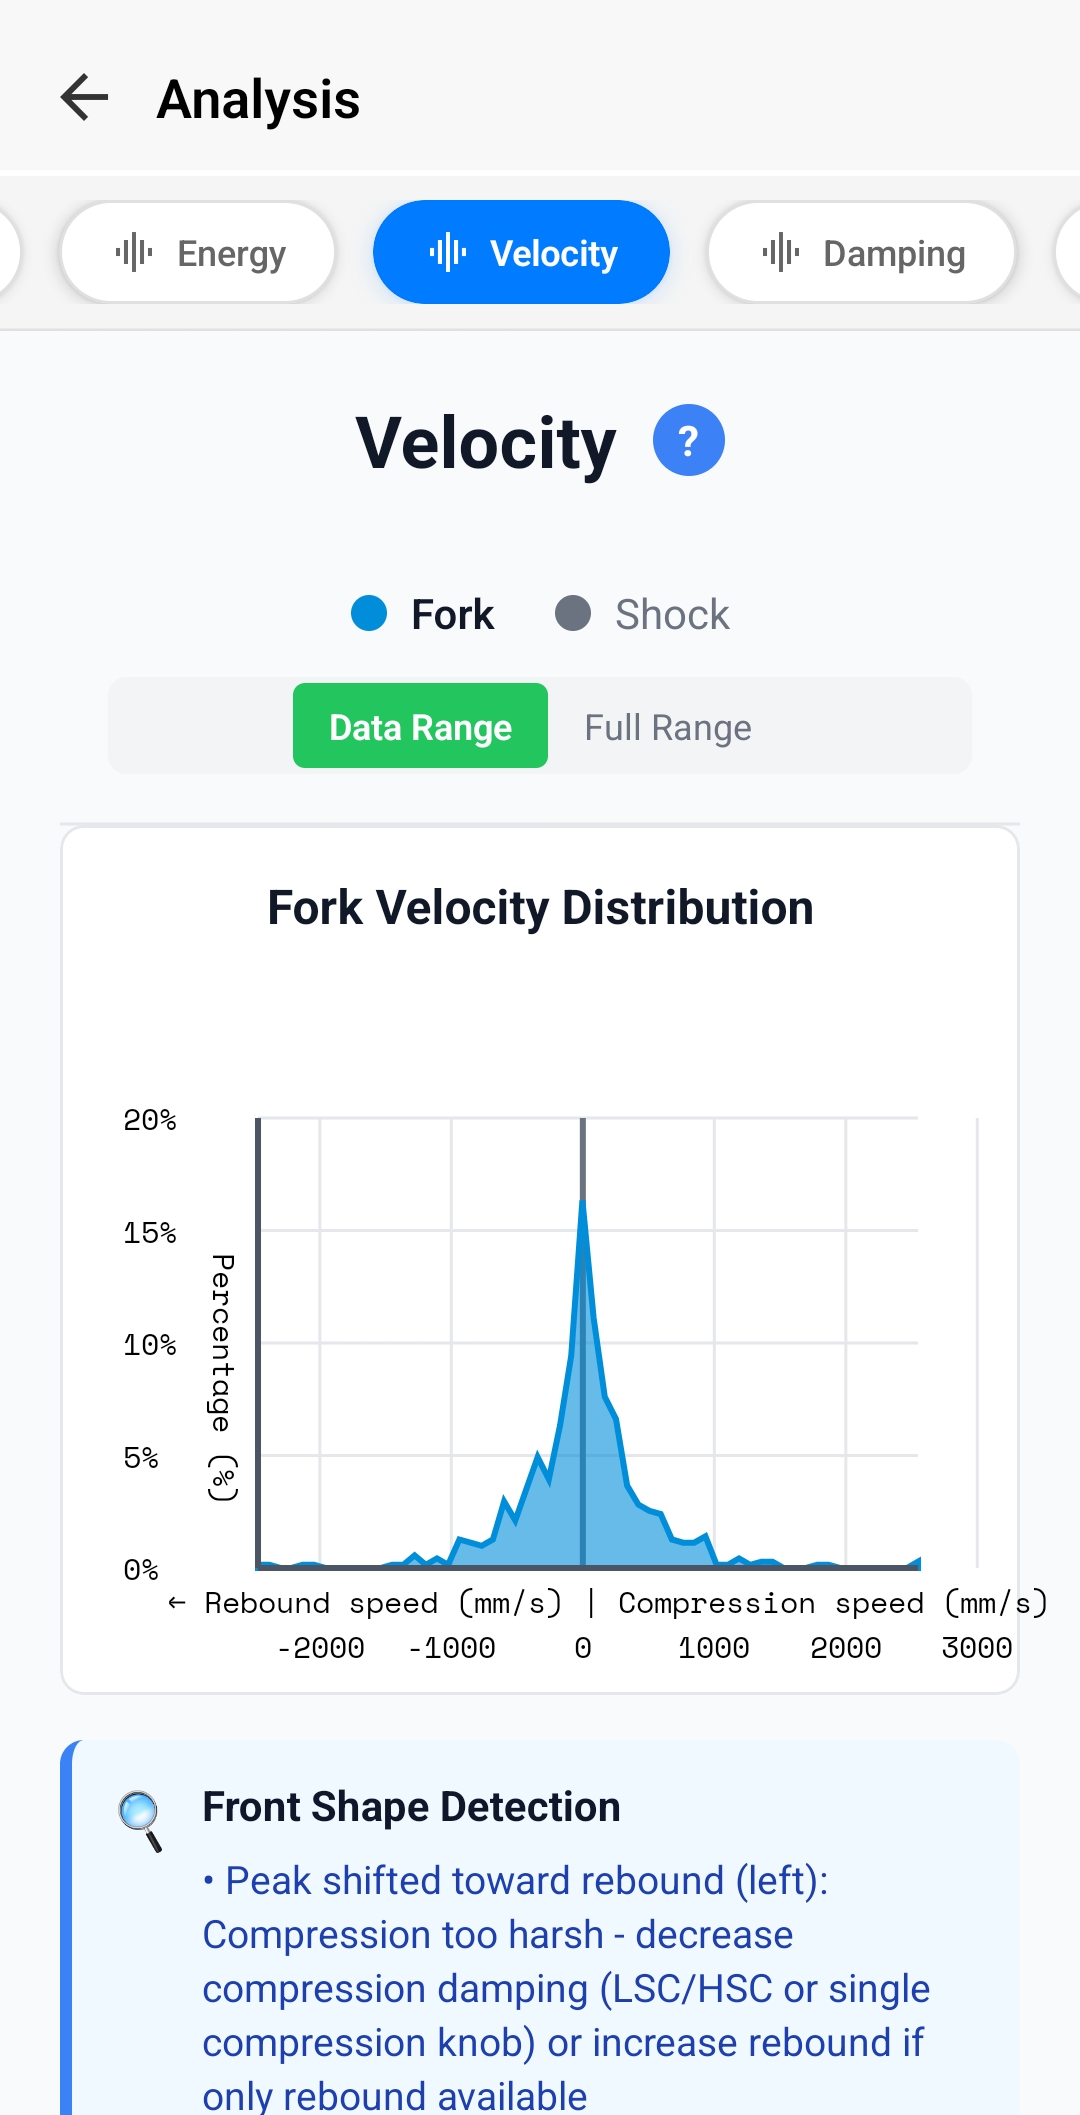
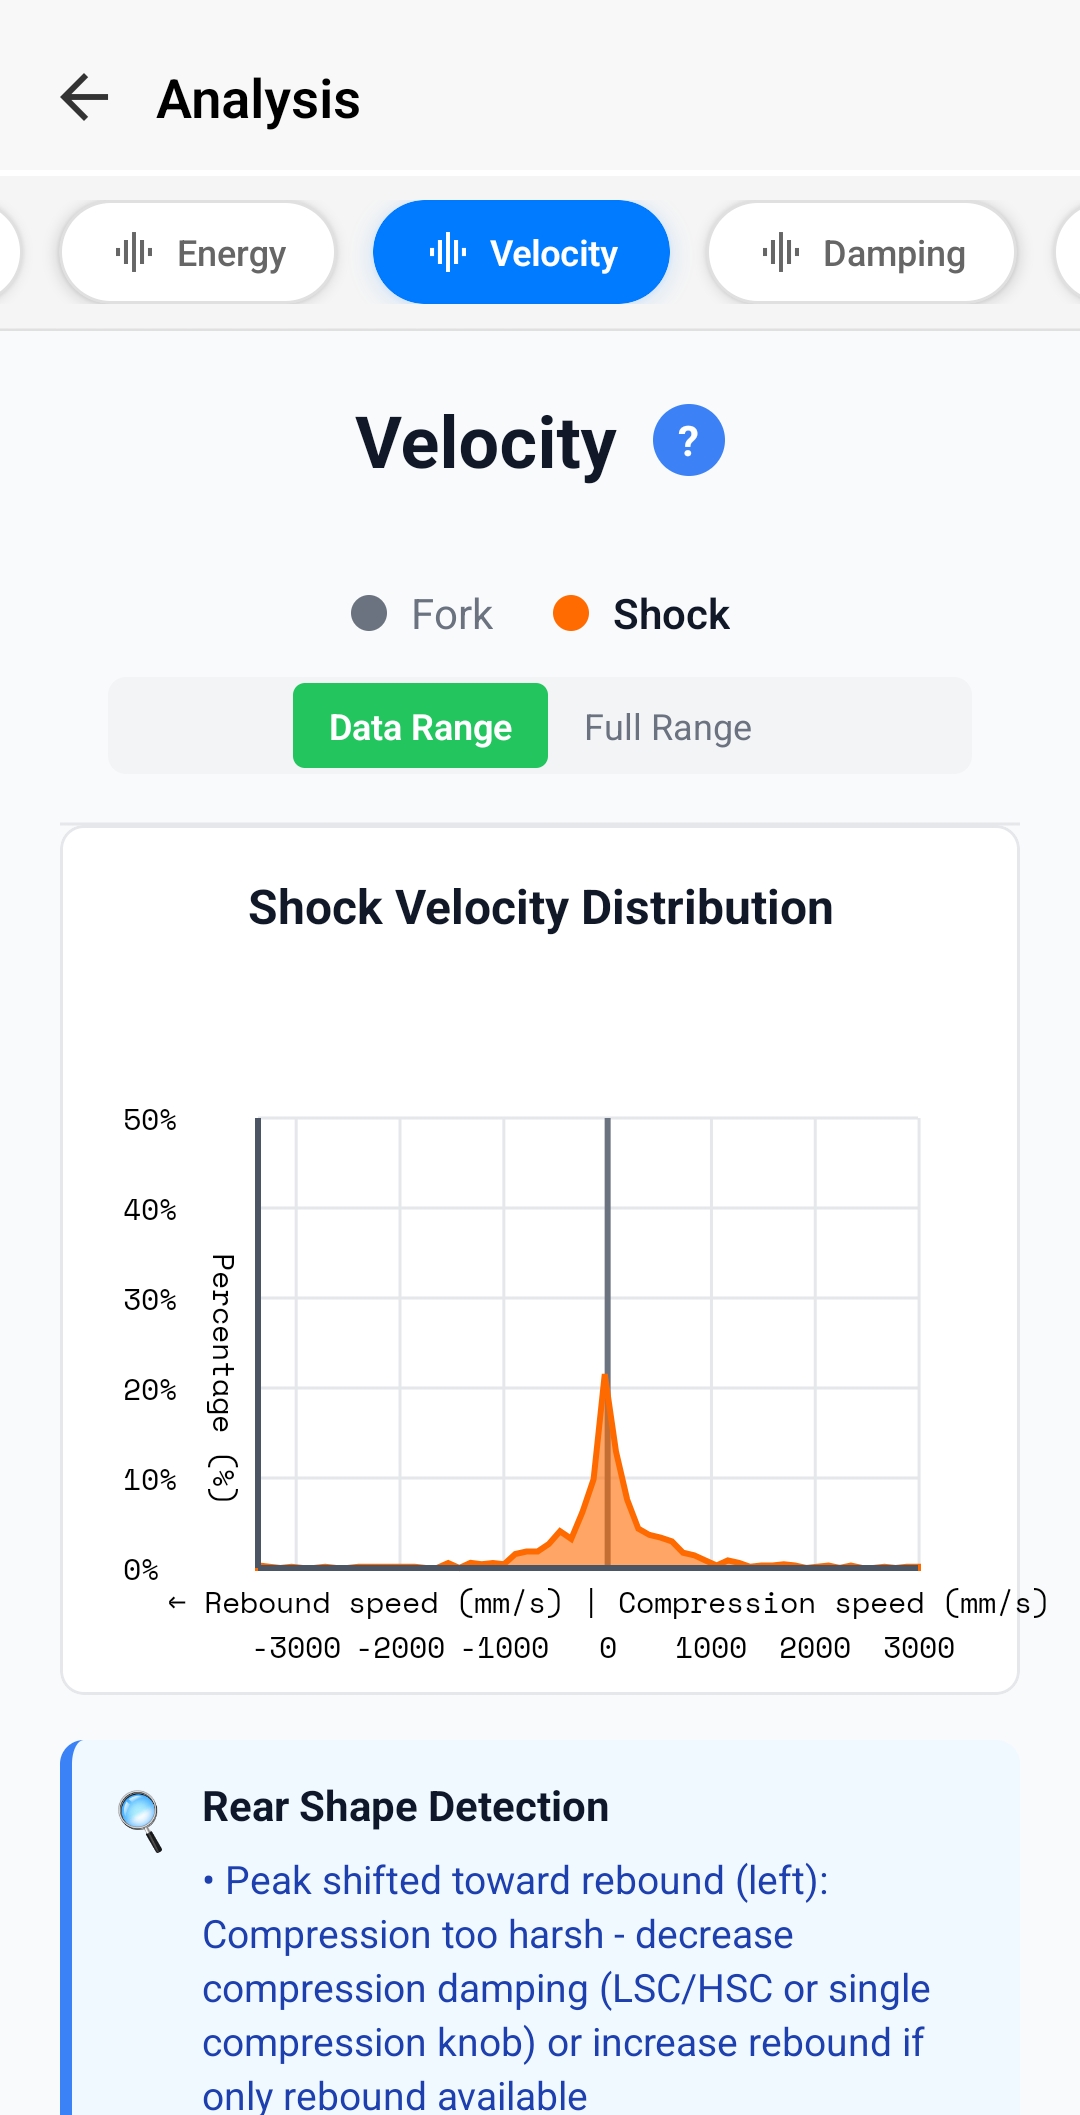
Understanding Velocity Distribution
- Left Side (Negative values): Rebound speeds - suspension extending back out
- Right Side (Positive values): Compression speeds - suspension compressing into travel
- Peak Height & Position: Shows the most common suspension speed during your ride
- Width: Range of speeds experienced - wider means more varied terrain
- Shape: Symmetry and shape indicate damping balance
Reading Velocity Shapes
Balanced Shape (Symmetrical bell curve):
- Peak centered near zero
- Similar height and width on both sides
- Compression and rebound are well-matched
- Ideal - no damping adjustments needed
Peak Shifted Left (Toward Rebound):
- Rebound too fast - suspension extending quickly
- Feels harsh, kicks back, poor traction
- Add rebound damping (close clickers)
- Note: This matches the "compression too harsh" recommendation because fast rebound makes compression feel harsh
Peak Shifted Right (Toward Compression):
- Rebound too slow - suspension not extending fast enough
- Packs down, sits low in travel, feels dead
- Reduce rebound damping (open clickers)
Shape Detection Recommendations
The app automatically analyzes your velocity distribution shape and provides specific recommendations:
- "Peak shifted toward rebound (left)": Decrease compression damping (LSC/HSC) OR increase rebound if only rebound adjustment available
- "Peak shifted toward compression (right)": Increase compression damping OR decrease rebound
- "Wide distribution": May need to adjust both LSC and HSC independently for better control across speeds
- "Narrow, centered peak": Well-tuned suspension, minimal adjustments needed
Velocity vs Position Analysis
Understanding progressive damping behavior
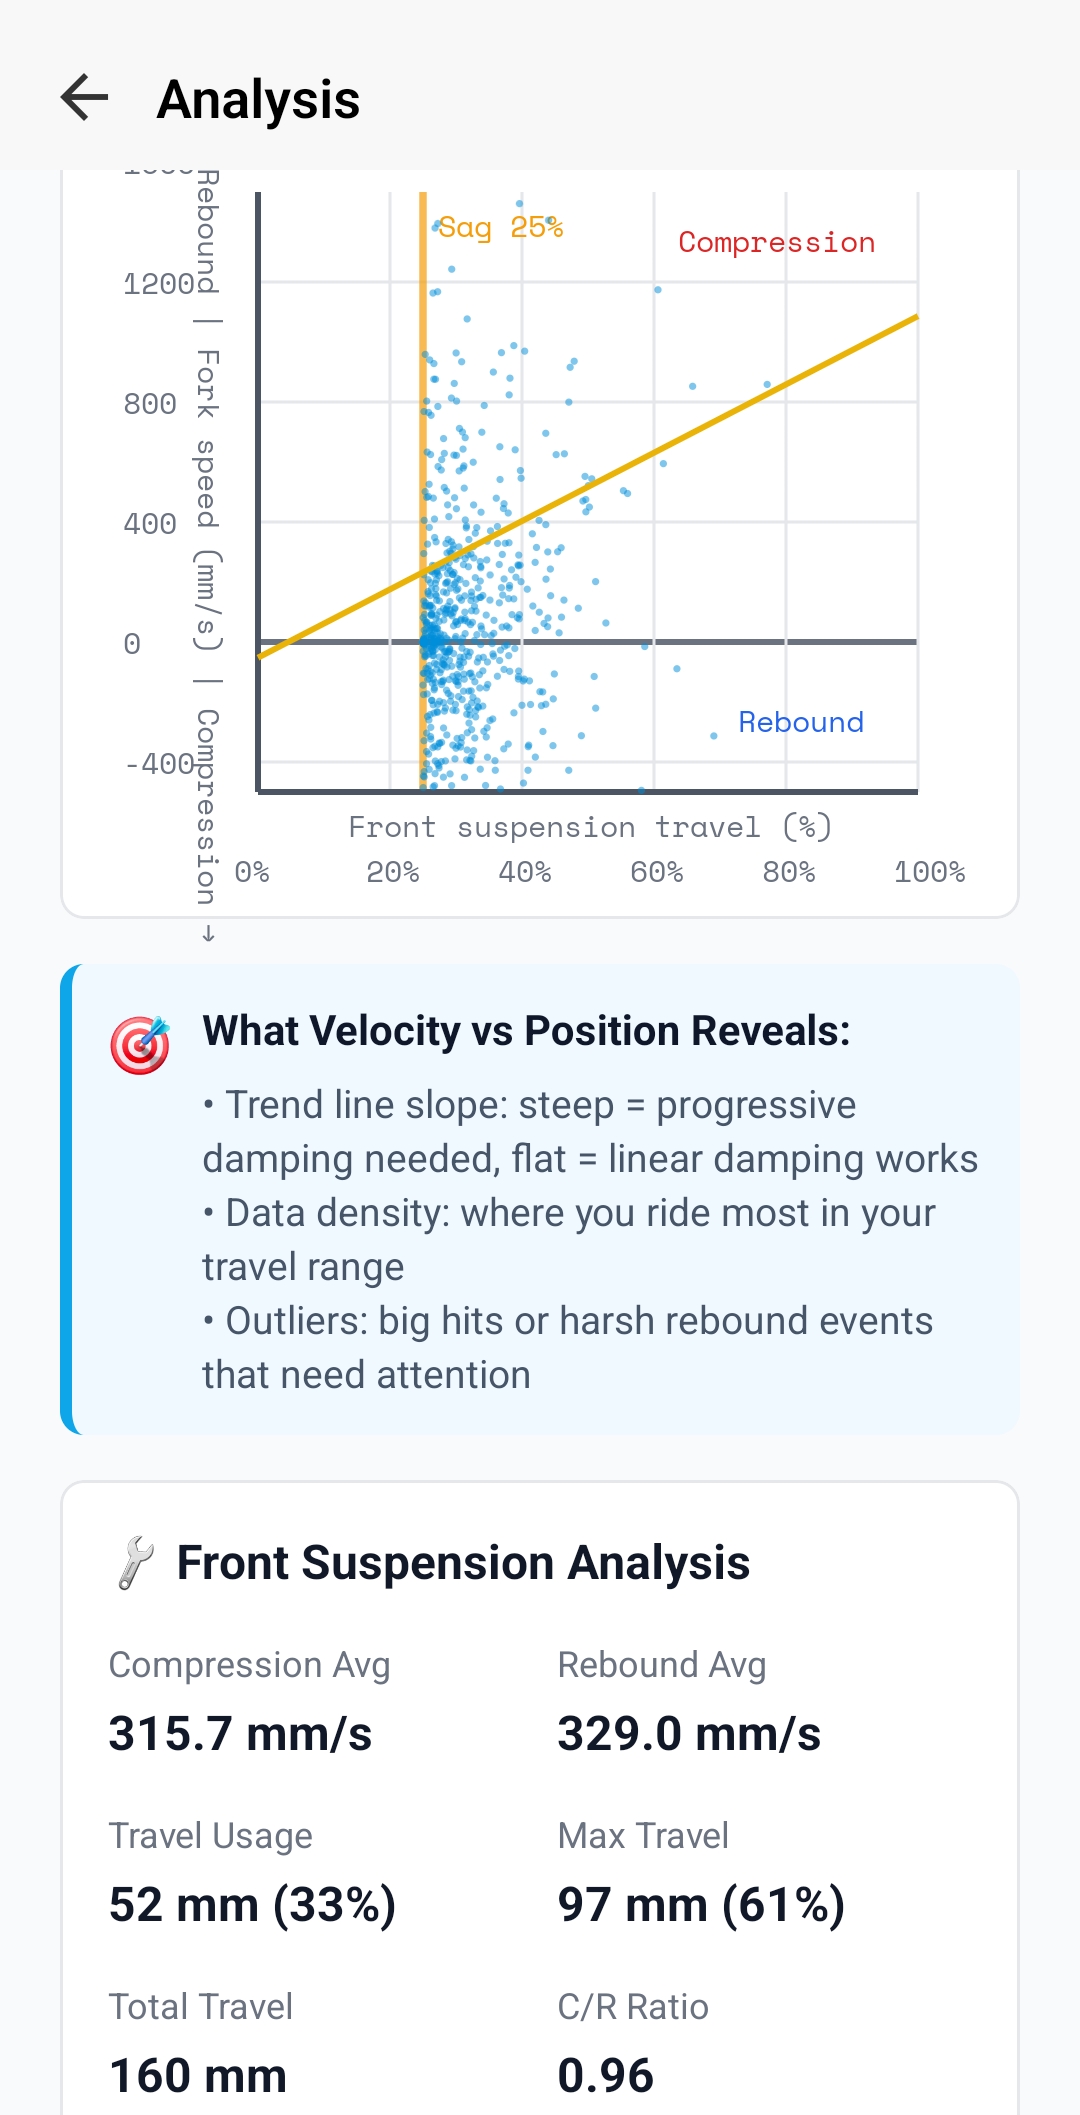
Understanding the Chart
- X-Axis (Horizontal): Travel position from 0% (fully extended) to 100% (fully compressed)
- Y-Axis (Vertical): Suspension speed - top half is rebound (extending), bottom half is compression (compressing)
- SAG Line (Vertical orange): Your sag position (typically 25-30% of travel)
- Trend Lines (Orange): Show average speed patterns through travel
- Data Density: Where dots are most concentrated shows where you ride most
Key Patterns to Look For
Steep Trend Line Slope:
- Speed increases significantly as you go deeper into travel
- Progressive damping - more resistance deeper in travel
- Good for preventing bottom-outs on big hits
- May need to add HSC or volume spacers if still bottoming harshly
Flat Trend Line:
- Consistent speed throughout travel range
- Linear damping - same resistance across travel
- Good for predictable, consistent feel
- May bottom-out more easily on harsh impacts
Data Density Patterns:
- Dense around SAG line: Spending most time in balanced position - good for smooth trails
- Dense in mid-travel (40-60%): Active suspension use - ideal for aggressive riding
- Dense in deep travel (70-100%): Using lots of travel - may be too soft or very rough terrain
What It Reveals About Setup
- Outliers (Extreme speeds): Big hits or harsh rebound events that need attention - check if they're causing harsh feedback
- Compression trend line angle: Shows how quickly you're hitting bumps through travel - steep = aggressive riding or harsh terrain
- Rebound trend line angle: Shows how fast suspension is returning - should mirror compression trend for balanced damping
- Gaps in data: Areas of travel rarely used - might indicate setup preventing access to full travel range
Current Setup Information
Track your suspension settings and compare changes
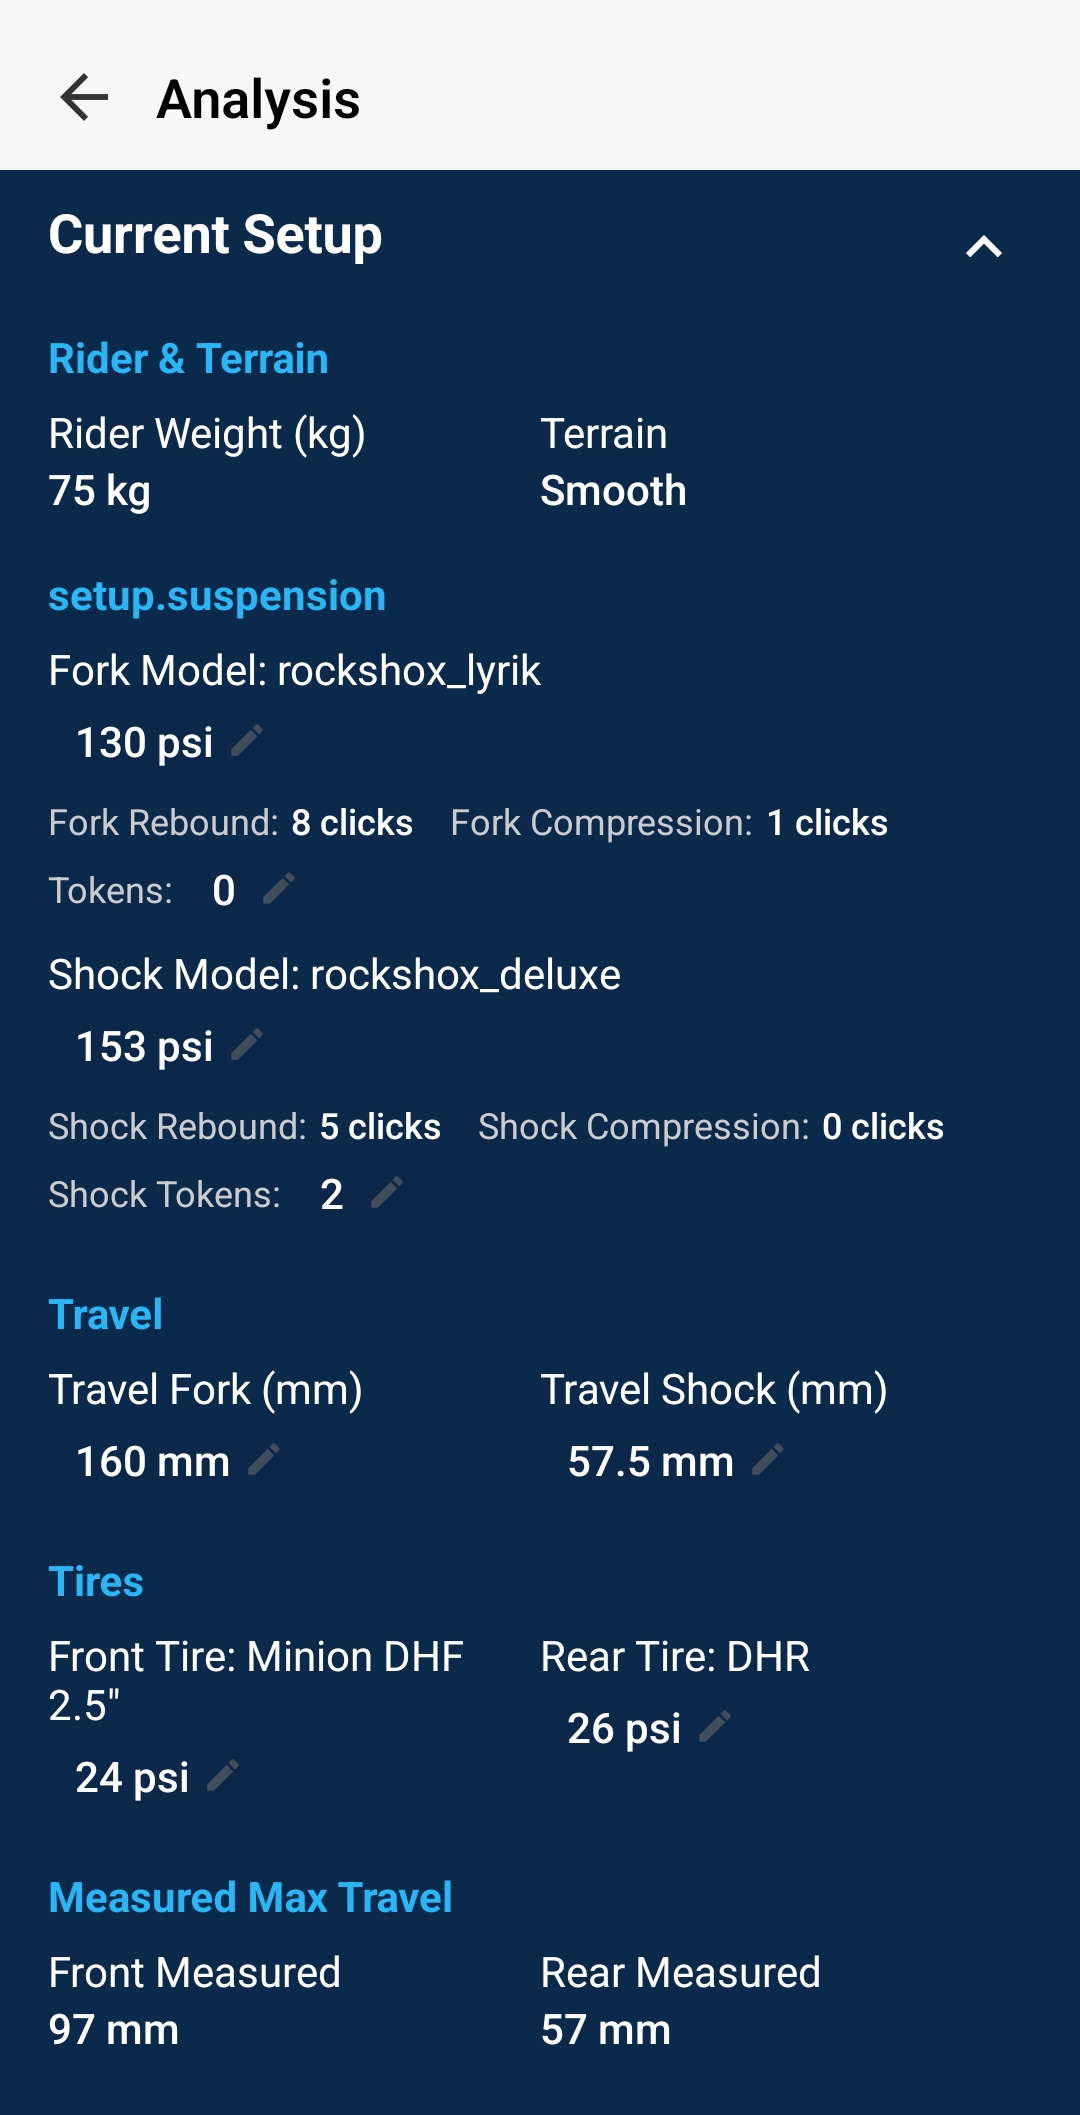
Setup Information Sections
Rider & Terrain:
- Rider weight with gear - affects spring rate and sag
- Terrain type - context for interpreting results
Suspension Settings:
- Fork/shock model and travel
- Air pressure (PSI) or spring rate
- Rebound damping (clicks from closed)
- Compression damping (clicks from closed)
- Volume spacers/tokens installed
Travel Measurements:
- Total available travel
- Maximum travel used (from o-ring or sensor)
How to Use Setup Tracking
- Before Each Ride: Record your current settings in the app
- When Making Changes: Only adjust one setting at a time (e.g., +5 PSI, or +2 clicks rebound)
- Test & Compare: Ride similar terrain and compare analysis results
- Establish Baseline: Find settings you like and save them as reference
- Track Conditions: Note if conditions changed (wet vs dry, temperatures, etc.)
Putting It All Together
Use these analysis tools together to build a complete picture of your suspension performance and make informed tuning decisions.
Recommended Analysis Workflow
1. Check Travel
Start with travel distribution - is your air pressure/spring rate correct?
2. Balance Damping
Use damping and velocity analysis to balance compression/rebound.
3. Verify Energy
Check energy analysis to confirm suspension is absorbing impacts efficiently.
4. Fine-tune
Use velocity vs position for advanced tuning of specific travel zones.